Diversified industrial manufacturing company Worthington (NYSE: WOR) reported revenue ahead of Wall Street’s expectations in Q3 CY2026, with sales up 13.2% year on year to $343.9 million. Its non-GAAP profit of $0.82 per share was 9.3% above analysts’ consensus estimates.
Is now the time to buy Worthington? Find out by accessing our full research report, it’s free.
Worthington (WOR) Q3 CY2026 Highlights:
- Revenue: $343.9 million vs analyst estimates of $330.2 million (13.2% year-on-year growth, 4.1% beat)
- Adjusted EPS: $0.82 vs analyst estimates of $0.75 (9.3% beat)
- Adjusted EBITDA: $74.02 million vs analyst estimates of $69.62 million (21.5% margin, 6.3% beat)
- Operating Margin: 3.8%, in line with the same quarter last year
- Free Cash Flow Margin: 15.7%, up from 9.2% in the same quarter last year
- Market Capitalization: $2.85 billion
“We started fiscal 2027 with solid performance as our teams continued to execute well and deliver for our customers,” said Worthington Enterprises President and CEO Joe Hayek. “We generated 7% organic growth, grew adjusted EBITDA by 10% and nearly doubled free cash flow. These results reflect the progress we are making as we continue to optimize and grow Worthington Enterprises.”Financial highlights for the current year and prior year quarters are as follows:
Company Overview
Founded by a steel salesman, Worthington (NYSE: WOR) specializes in steel processing, pressure cylinders, and engineered cabs for commercial markets.
Revenue Growth
Examining a company’s long-term performance can provide clues about its quality. Any business can experience short-term success, but top-performing ones enjoy sustained growth for years. Worthington’s demand was weak over the last five years as its sales fell at a 16.9% annual rate. This was below our standards and suggests it’s a low quality business.
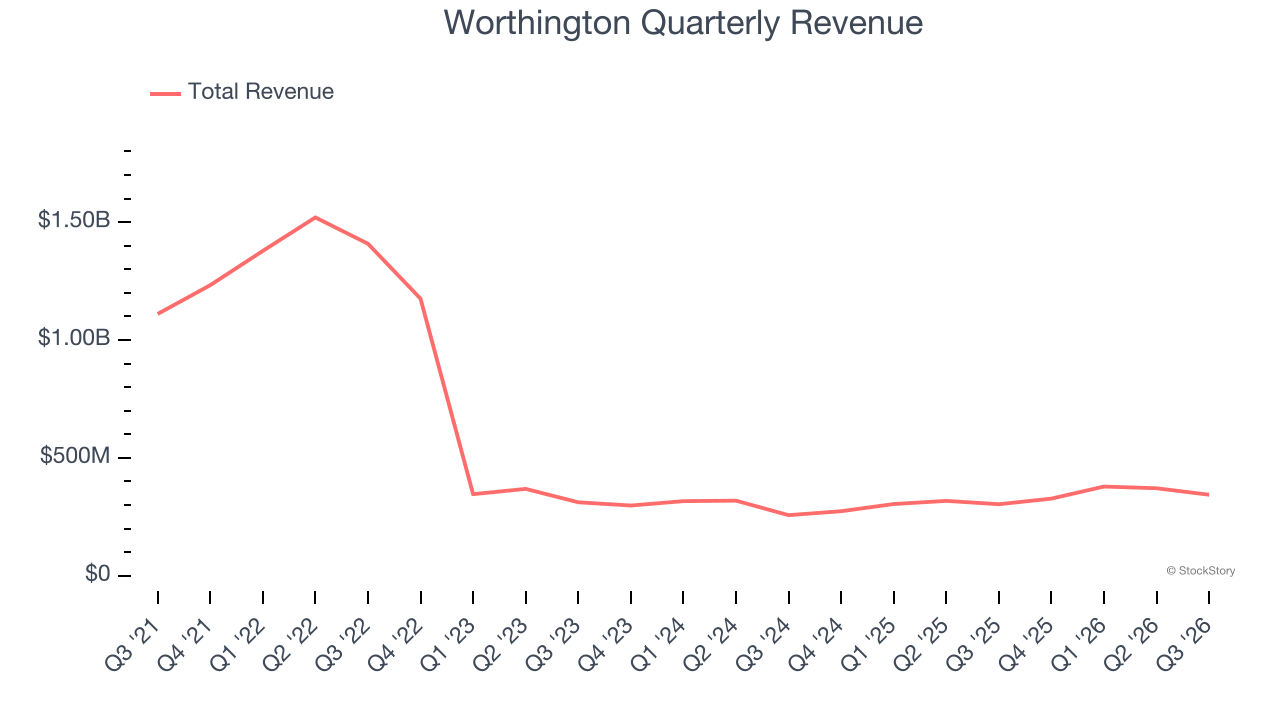
Long-term growth is the most important, but within industrials, a half-decade historical view may miss new industry trends or demand cycles. Worthington’s annualized revenue growth of 9.2% over the last two years is above its five-year trend, suggesting its demand recently accelerated. 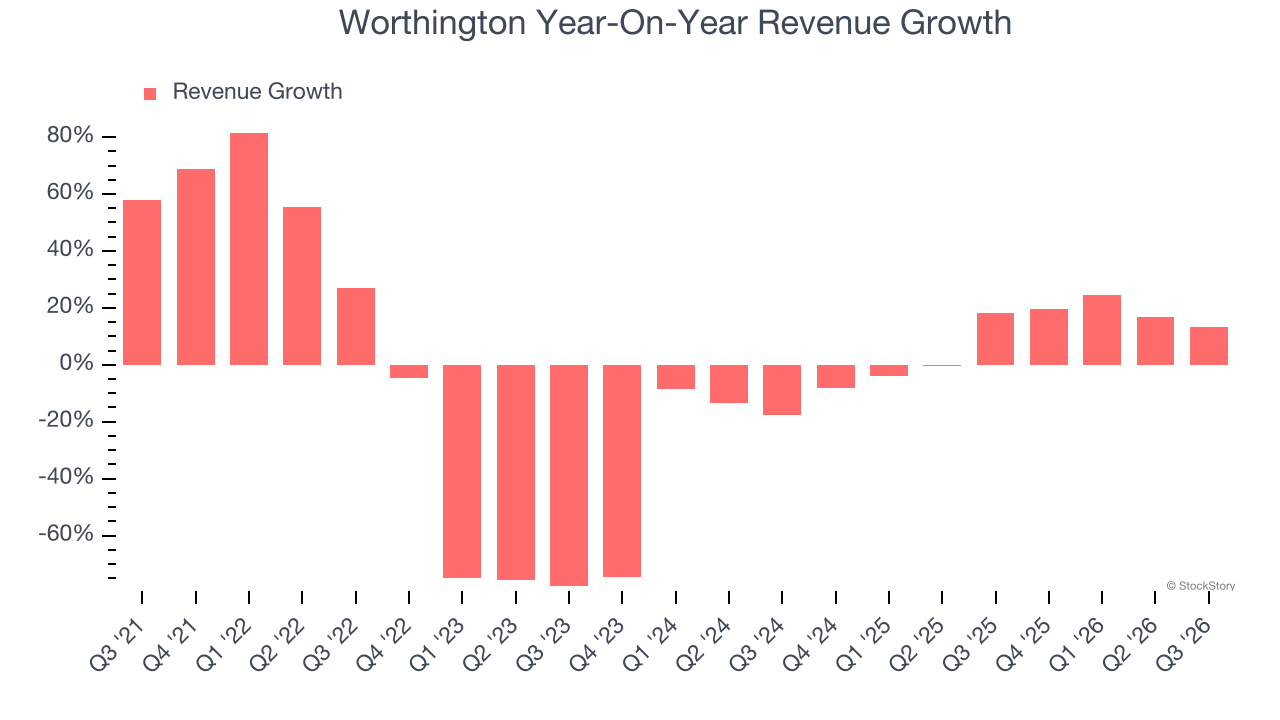
We can dig further into the company’s revenue dynamics by analyzing its most important segments, Consumer Products and Building Products, which are 62.5% and 37.5% of revenue. Over the last two years, Worthington’s Consumer Products revenue (cylinders, torches, balloon kits, tools) averaged 31.8% year-on-year growth while its Building Products revenue (refrigerant, cylinders, tanks) averaged 10.1% growth. 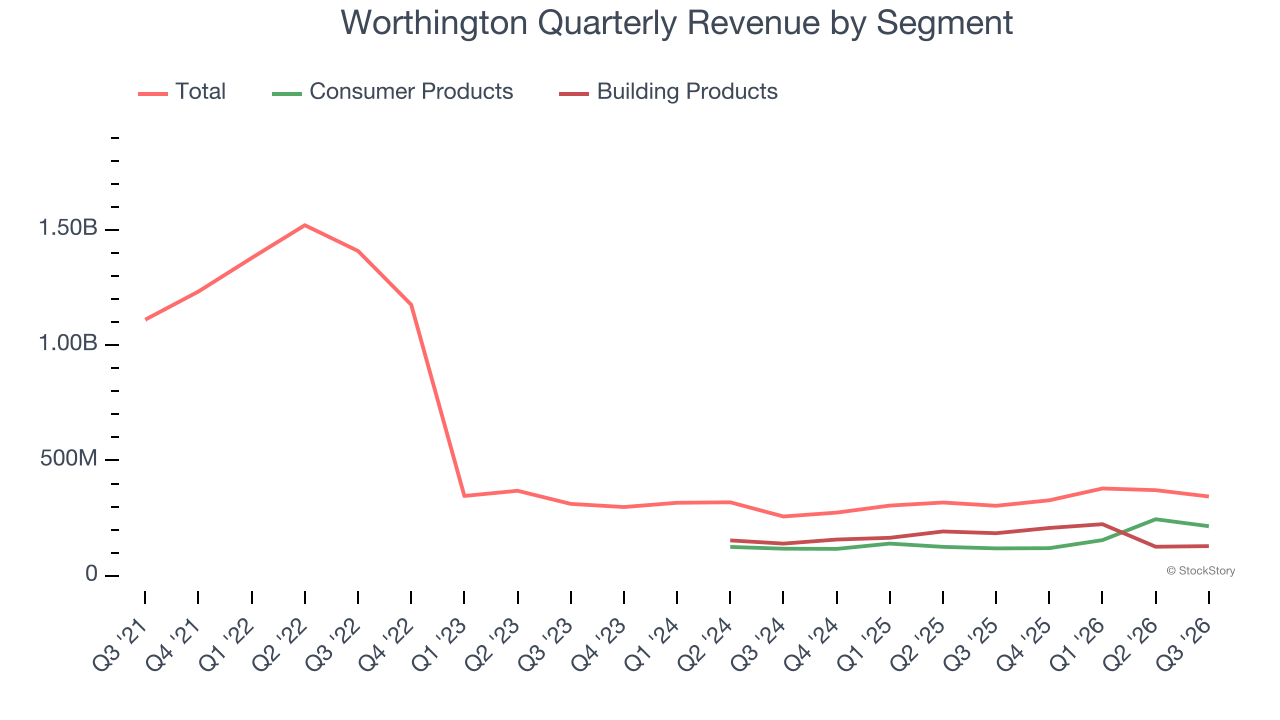
This quarter, Worthington reported year-on-year revenue growth of 13.2%, and its $343.9 million of revenue exceeded Wall Street’s estimates by 4.1%.
Looking ahead, sell-side analysts expect revenue to grow 4.1% over the next 12 months, a deceleration versus the last two years. This projection is underwhelming and implies its products and services will face some demand challenges.
ONE MORE THING: The $21 AI Application Stock Wall Street Forgot. While Wall Street obsesses over who’s building AI, one company is already using it to print money. And nobody’s paying attention.
AI chip stocks trade at ridiculous valuations. This company processes a trillion consumer signals monthly using AI and trades at a third of the price. The gap won’t last. The institutions will figure it out. You need to see this first. Read the FREE Report Before They Notice.
Operating Margin
Worthington’s operating margin has risen over the last 12 months and averaged 2.4% over the last five years. The company’s higher efficiency is a breath of fresh air, but its suboptimal cost structure means it still sports lousy profitability for an industrials business. This result isn’t too surprising given its low gross margin as a starting point.
Analyzing the trend in its profitability, Worthington’s operating margin might have fluctuated slightly but has generally stayed the same over the last five years, meaning it will take a fundamental shift in the business model to change.
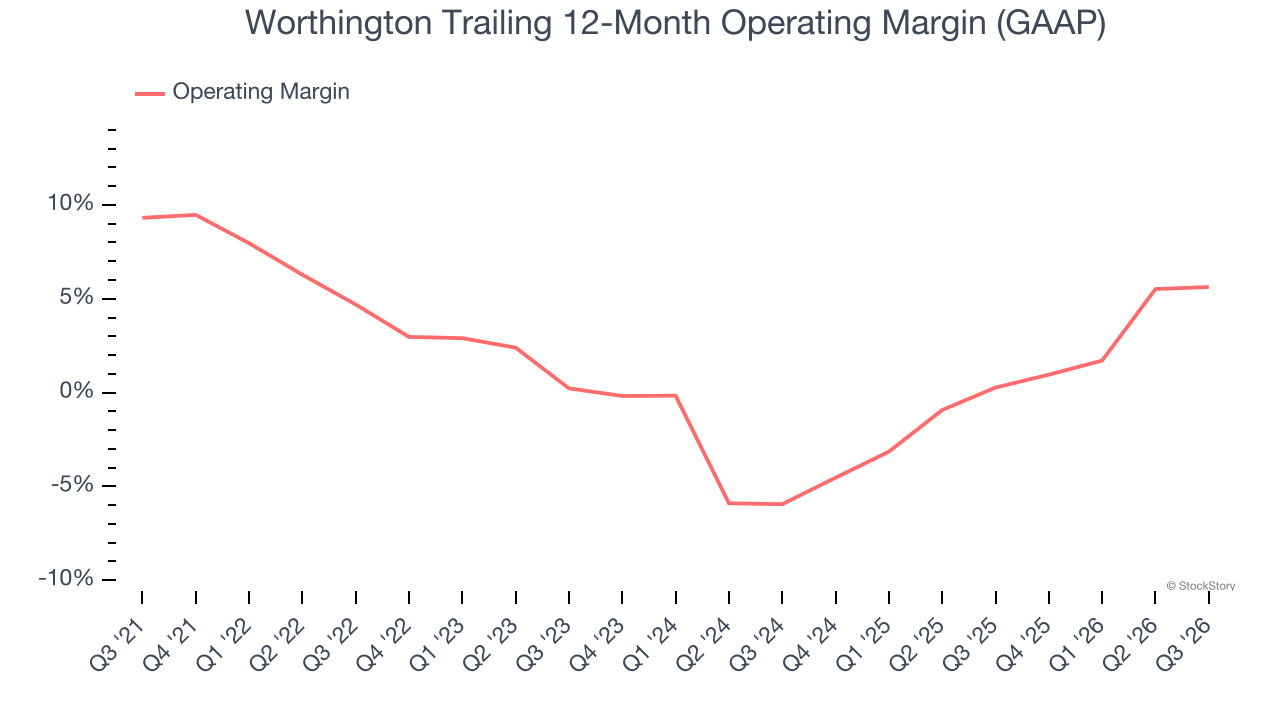
In Q3, Worthington generated an operating margin profit margin of 3.8%, in line with the same quarter last year. This indicates the company’s cost structure has recently been stable.
Earnings Per Share
We track the long-term change in earnings per share (EPS) for the same reason as long-term revenue growth. Compared to revenue, however, EPS highlights whether a company’s growth is profitable.
Sadly for Worthington, its EPS and revenue declined by 14.7% and 16.9% annually over the last five years. We tend to steer our readers away from companies with falling revenue and EPS, where diminishing earnings could imply changing secular trends and preferences. If the tide turns unexpectedly, Worthington’s low margin of safety could leave its stock price susceptible to large downswings.
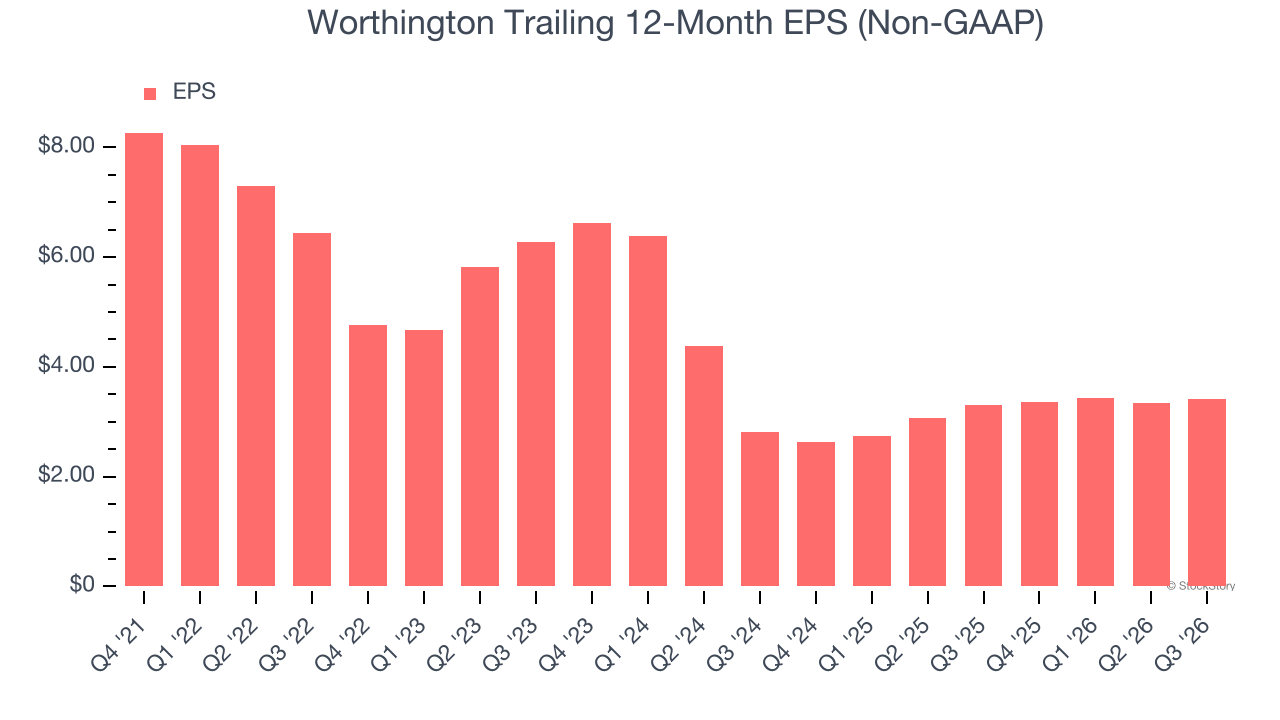
A five-year view shows that Worthington has repurchased its stock, shrinking its share count by 5.2%. This tells us its EPS outperformed its revenue not because of increased operational efficiency but financial engineering, as buybacks boost per share earnings. 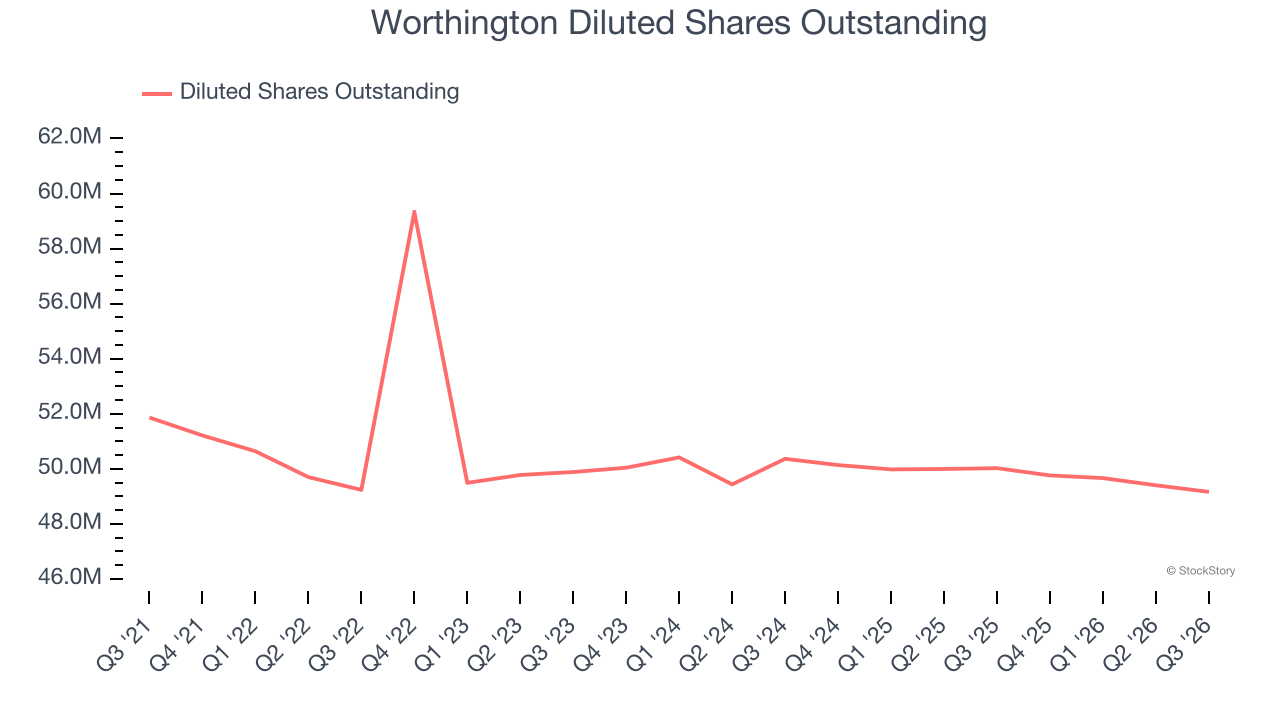
Like with revenue, we analyze EPS over a more recent period because it can provide insight into an emerging theme or development for the business.
For Worthington, its two-year annual EPS growth of 10.1% was higher than its five-year trend. This acceleration made it one of the faster-growing industrials companies in recent history.
In Q3, Worthington reported adjusted EPS of $0.82, up from $0.74 in the same quarter last year. This print beat analysts’ estimates by 9.3%. Over the next 12 months, Wall Street expects Worthington’s full-year EPS to grow 10.5% from $3.42 to $3.78.
Key Takeaways from Worthington’s Q3 Results
We were impressed by how significantly Worthington blew past analysts’ revenue expectations this quarter. We were also glad its EBITDA outperformed Wall Street’s estimates. Zooming out, we think this was a solid print. The stock traded up 10.5% to $65.61 immediately after reporting.
Worthington may have had a good quarter, but does that mean you should invest right now? We think that the latest quarter is only one piece of the longer-term business quality puzzle. Quality, when combined with valuation, can help determine if the stock is a buy. We cover that in our actionable full research report which you can read here (it’s free).