Friend: “Rob, the stock market keeps making all-time highs.”
Me: “So what?”
I mean no disrespect to my friend, or to anyone else who gets excited about “all-time highs” for the S&P 500 Index ($SPX) or other major market indexes. But those highs mask the broader story. And there’s a very good reason why that’s the case.
Most money today goes into S&P 500 index funds. The S&P 500 is crowded at the top. That means roughly 400-450 of those 500 stocks don’t matter at all. And beyond the top 25-50, most do not matter very much.
For investors in SPY (SPY), VOO (VOO), IVV (IVV), and scores of other ETFs that sound different but act similarly, the headlines are all that matter. Because that’s what they own. Even if those 450 or so stocks falter, it is like that proverbial tree in the forest. Does it make a sound if no one is around to hear it? Of course, the same is true when they rally.
Here are the top 10 (11 shown since Alphabet (GOOG) (GOOGL) is 2 tickers). That’s 40% of the market cap right there. 10 companies.
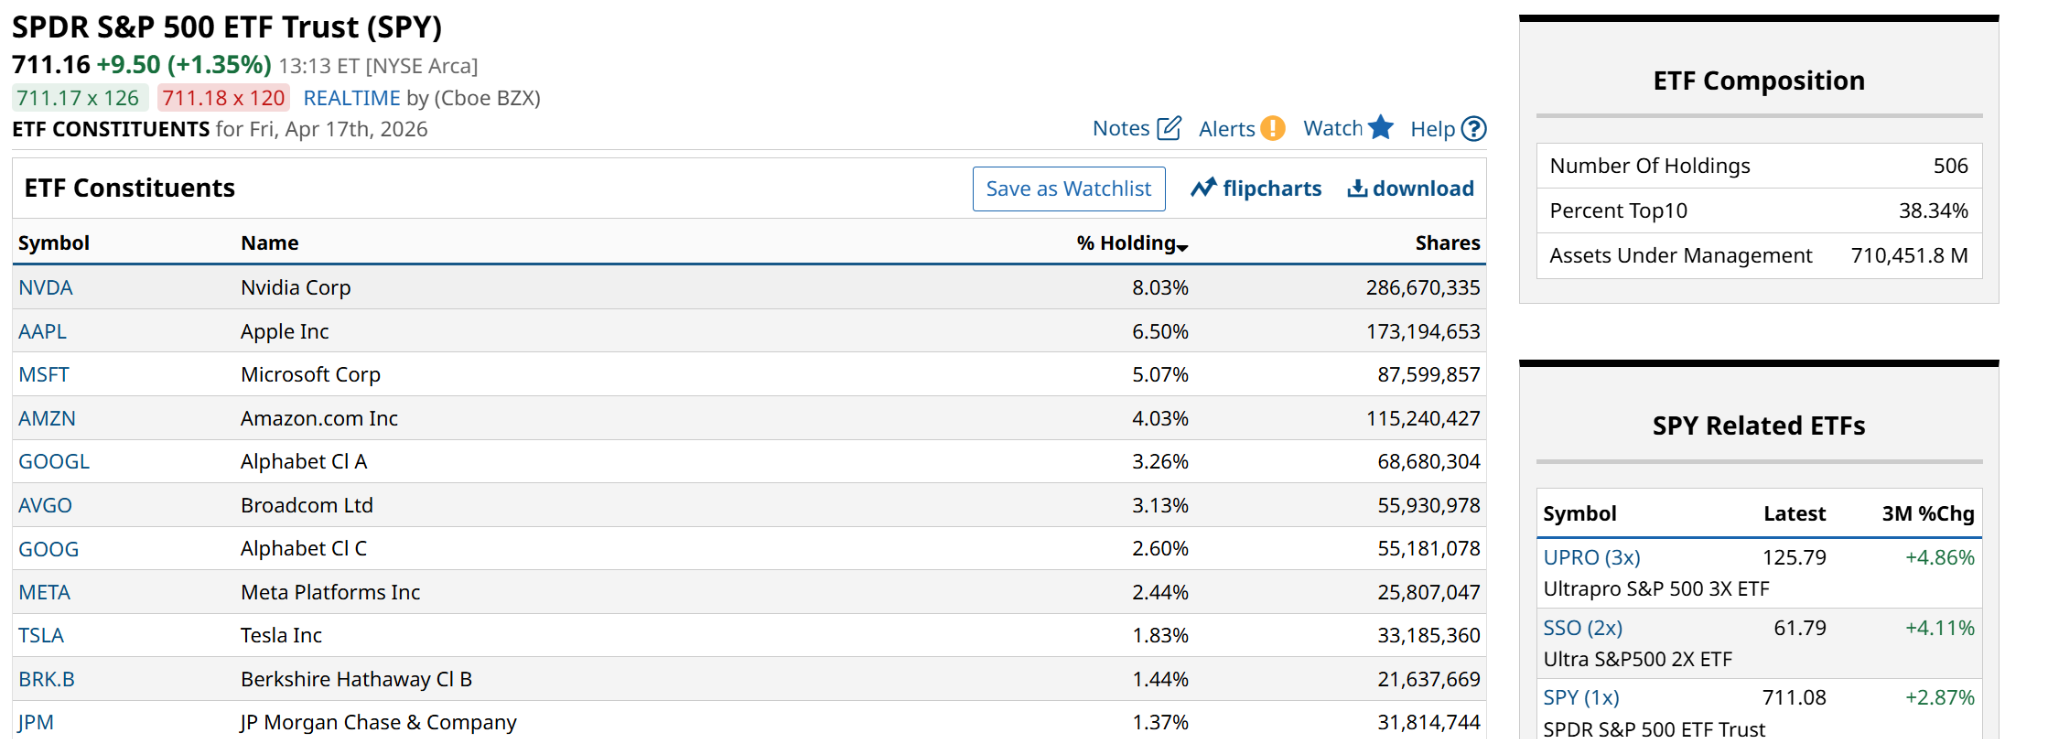
The broad market indexes often paint a picture of relentless growth, but a look under the hood of the S&P 500 reveals a market that is anything but broad based. While the headline index continues to climb, driven by an almost singular obsession with the AI trade and geopolitical headlines, the reality for the average stock in the index is significantly grimmer.
I looked at a watchlist I maintain of S&P 500 stocks. I reviewed individual stock performance over the past 52 weeks. Thanks to some fortunate calendar timing, where last year’s tariff tantrum had just ended and apparently so have Iran War fears, SPY is up 35% since this same time last year.
A few weeks ago, that figure was closer to 10%. Games with numbers, so to speak. But also the type of hype that newer investors are not likely to see through. So there, I said it.
The massive gap here: the AI elite and the rest of the market. If your portfolio feels like it is treading water, or worse, you aren’t alone. You are simply witnessing a market that hasn’t actually broadened in over three years.
The Stats: A Tale of Two Markets
Based on an analysis of S&P 500 constituents, the statistical evidence of this narrow leadership is overwhelming:
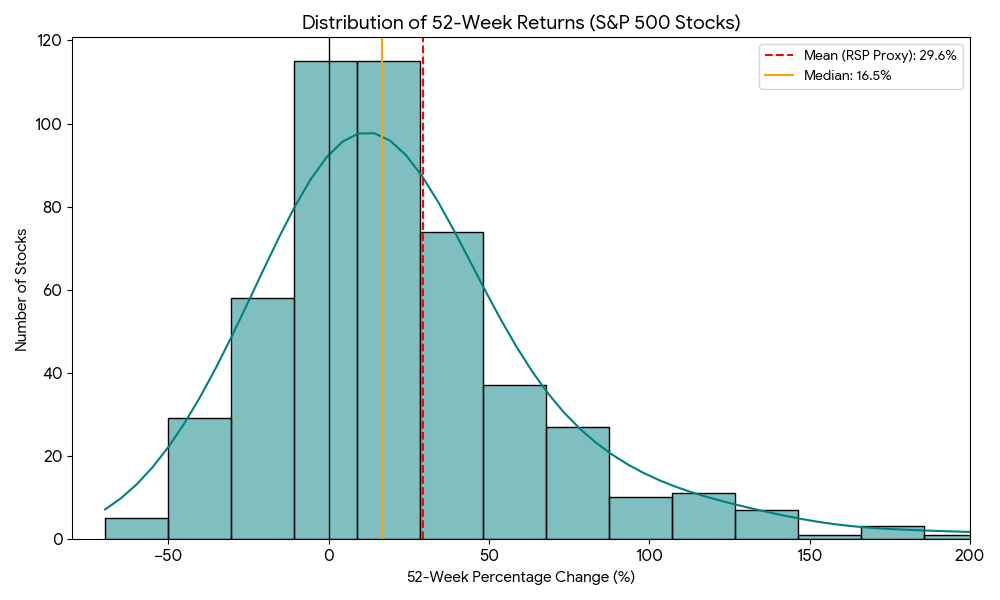
- While the average (mean) return of these stocks is 29.6% — a proxy for equal-weight performance (RSP) — the median return is just 16.5%. This 13% gap proves that the average result is being heavily inflated by a small group of super-performers.
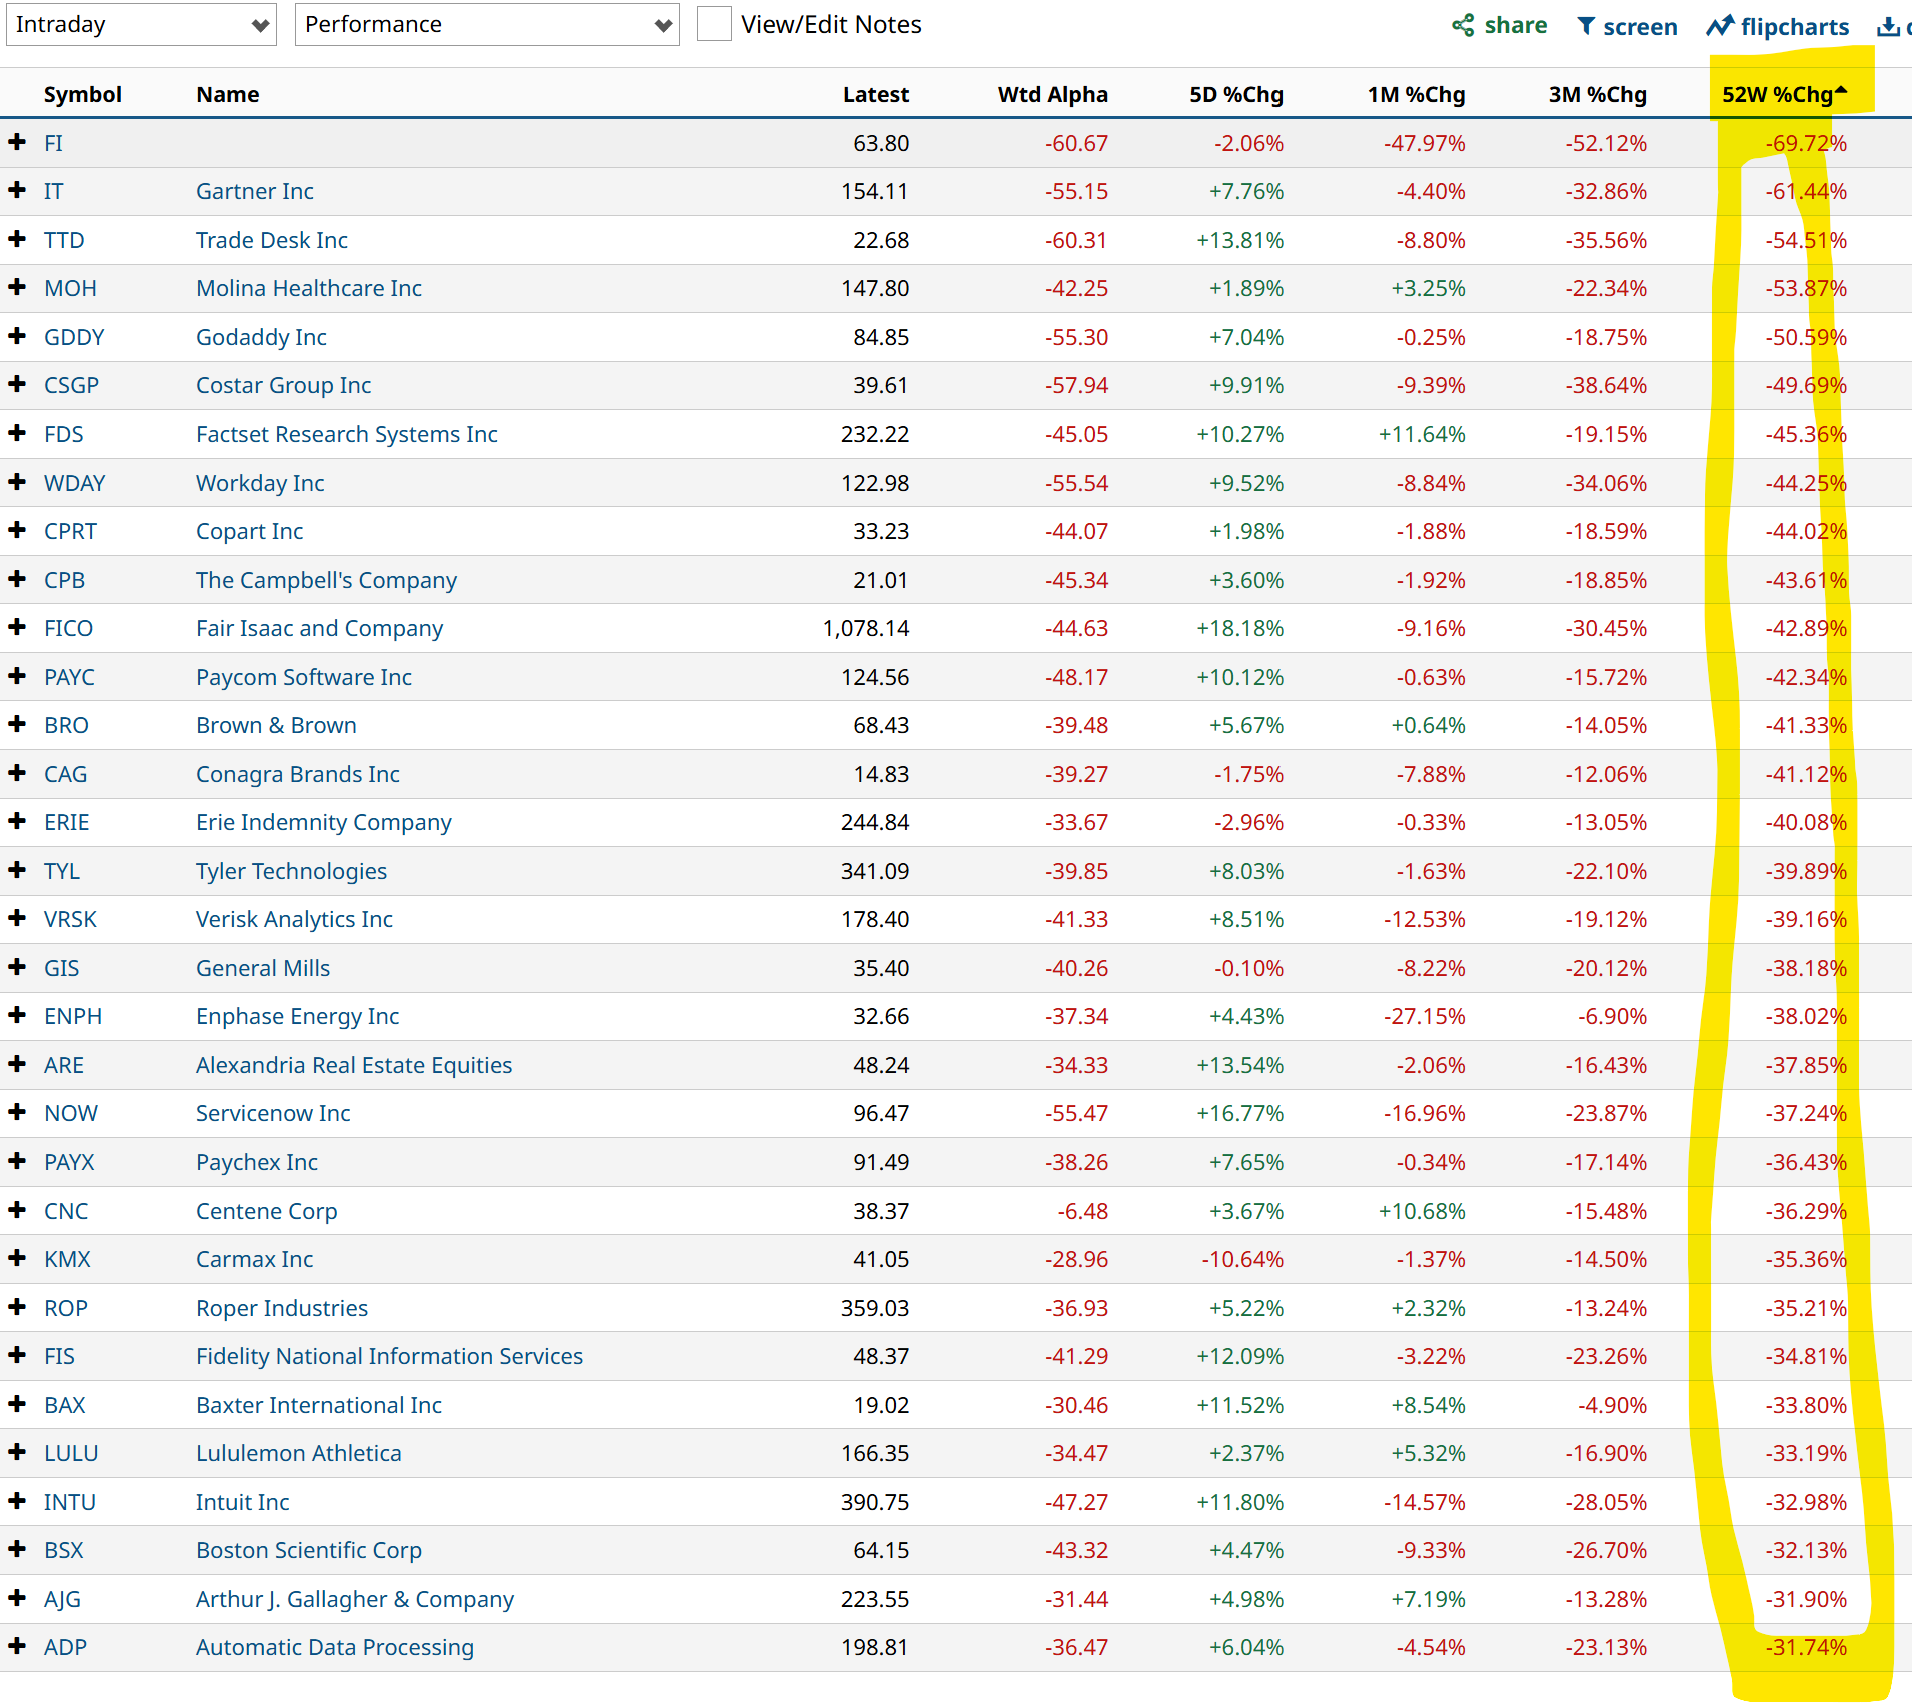
- Nearly 30% of the stocks in the S&P 500 have negative returns over the last year. That means three out of every 10 stocks in the world’s most watched index have actually lost money for investors.
- Roughly 20% of the index is down more than 10%, and over 11% of the stocks are down more than 20% on a 52-week basis.
For years, analysts have predicted a rotation into the “other 493” stocks beyond the Magnificent 7.
Yet the data confirms that we are still living in a top-heavy regime. The extreme outlier at the top of the list saw a return of over 912%, while the worst performer plummeted nearly 70%.
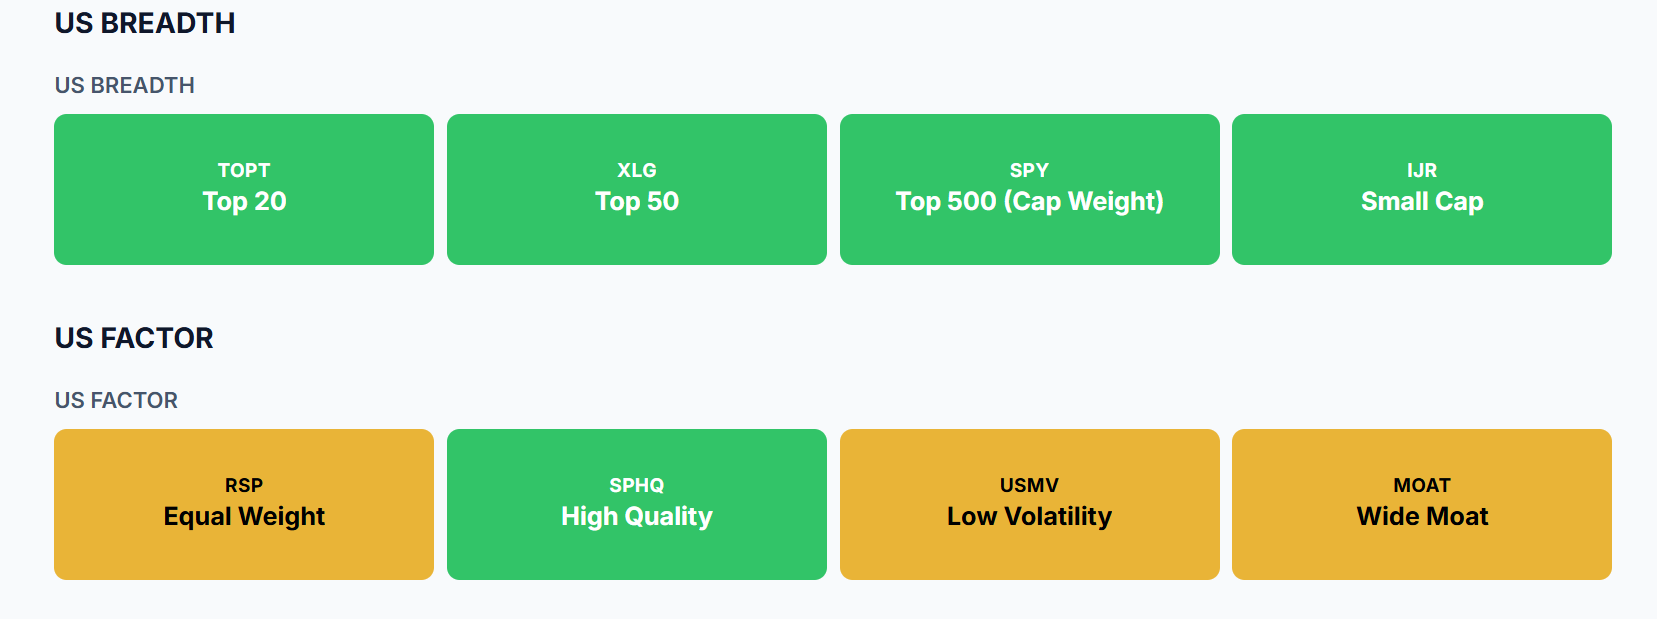
This ROAR Score analysis by market segment tells the story in living color. Look at the the top-heavy, cap-weighted ETFs on the top row, and the SPHQ High Quality ETF (SPHQ) that is one of those high-correlation funds to SPY. All green (lower risk). But RSP (RSP), low volatility (USMV) (USMV) and wide-moat stocks (MOAT) (MOAT), are all still in the neutral risk range. They have not yet bought in. Or put more properly, they continue to lag.
When a few massive names account for the lion’s share of index gains, the index becomes a “stock market” in name only. It is effectively a handful of tech and AI proxies dragging a reluctant crowd higher. If you haven’t been holding the specific winners of the AI trade, you have likely underperformed both the market-cap-weighted SPY and the equal-weighted RSP.
This is less about “what to do,” and more about something much more critical at a time when the stock market is as emotion- and liquidity-driven as I’ve ever seen. Enjoy the index-level gains, but make sure you know the whole story.
Rob Isbitts created the ROAR Score, based on his 40+ years of technical analysis experience. ROAR helps DIY investors manage risk and create their own portfolios. For Rob's written research, check out ETFYourself.com.
On the date of publication, Rob Isbitts did not have (either directly or indirectly) positions in any of the securities mentioned in this article. All information and data in this article is solely for informational purposes. For more information please view the Barchart Disclosure Policy here.
More news from Barchart
- Only 3 Dividend Kings Passed This Brutal Screen. They Could Pay You Well for Years to Come.
- United Airlines Stock Is Flying Higher as Strait of Hormuz Opening Promises to Lower Jet Fuel Prices. Should You Buy It Here?
- As Critical Metals Ups Its Stake in Greenland Rare Earths, Should You Buy CRML Stock Today?
- Why Many (or Most) of Your Stock Picks Have Not Been Successful