
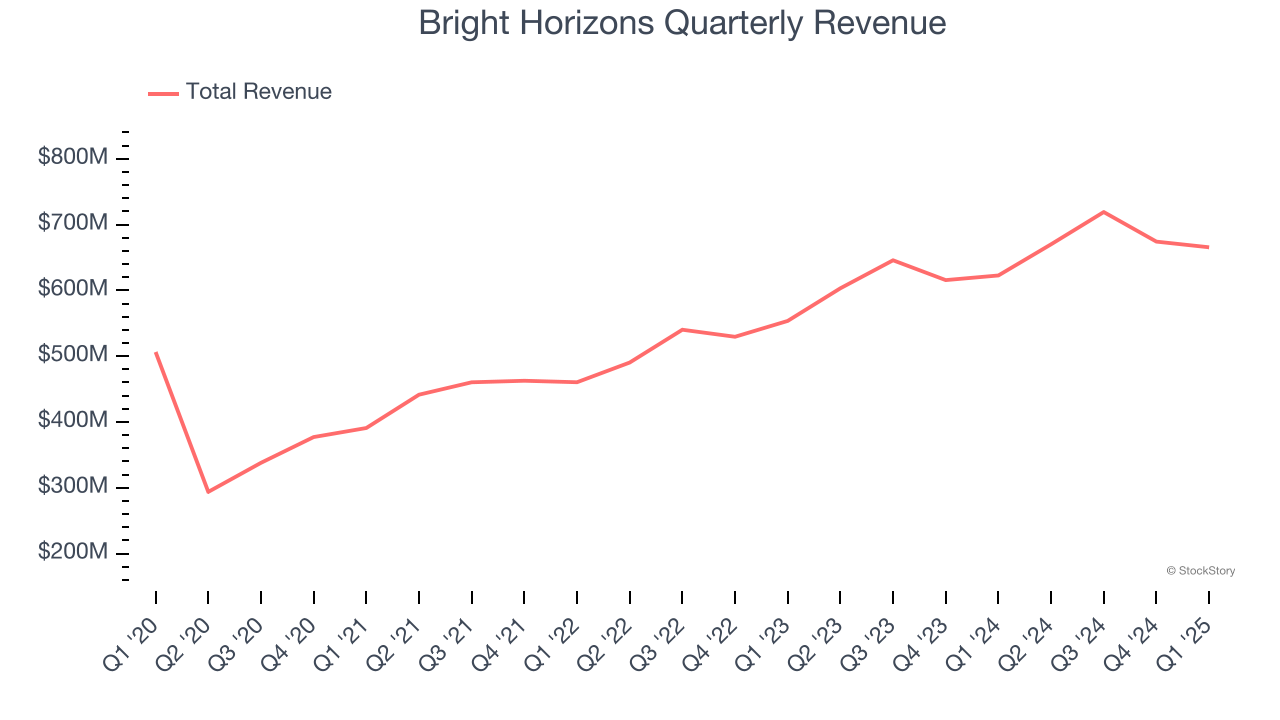
Child care and education company Bright Horizons (NYSE: BFAM) met Wall Street’s revenue expectations in Q1 CY2025, with sales up 6.9% year on year to $665.5 million. The company’s outlook for the full year was close to analysts’ estimates with revenue guided to $2.89 billion at the midpoint. Its non-GAAP profit of $0.77 per share was 19.5% above analysts’ consensus estimates.
Is now the time to buy Bright Horizons? Find out by accessing our full research report, it’s free.
Bright Horizons (BFAM) Q1 CY2025 Highlights:
- Revenue: $665.5 million vs analyst estimates of $665.5 million (6.9% year-on-year growth, in line)
- Adjusted EPS: $0.77 vs analyst estimates of $0.64 (19.5% beat)
- Adjusted EBITDA: $92.3 million vs analyst estimates of $85.55 million (13.9% margin, 7.9% beat)
- The company slightly lifted its revenue guidance for the full year to $2.89 billion at the midpoint from $2.88 billion
- Management reiterated its full-year Adjusted EPS guidance of $4.05 at the midpoint
- Operating Margin: 9.4%, up from 6.4% in the same quarter last year
- Free Cash Flow Margin: 10.7%, down from 15.6% in the same quarter last year
- Market Capitalization: $7.35 billion
“We are pleased with our solid start to the year,” said Stephen Kramer, Chief Executive Officer.
Company Overview
Founded in 1986, Bright Horizons (NYSE: BFAM) is a global provider of child care, early education, and workforce support solutions.
Sales Growth
A company’s long-term sales performance can indicate its overall quality. Any business can put up a good quarter or two, but the best consistently grow over the long haul. Over the last five years, Bright Horizons grew its sales at a sluggish 5.7% compounded annual growth rate. This was below our standard for the consumer discretionary sector and is a tough starting point for our analysis.
Long-term growth is the most important, but within consumer discretionary, product cycles are short and revenue can be hit-driven due to rapidly changing trends and consumer preferences. Bright Horizons’s annualized revenue growth of 13.6% over the last two years is above its five-year trend, but we were still disappointed by the results. 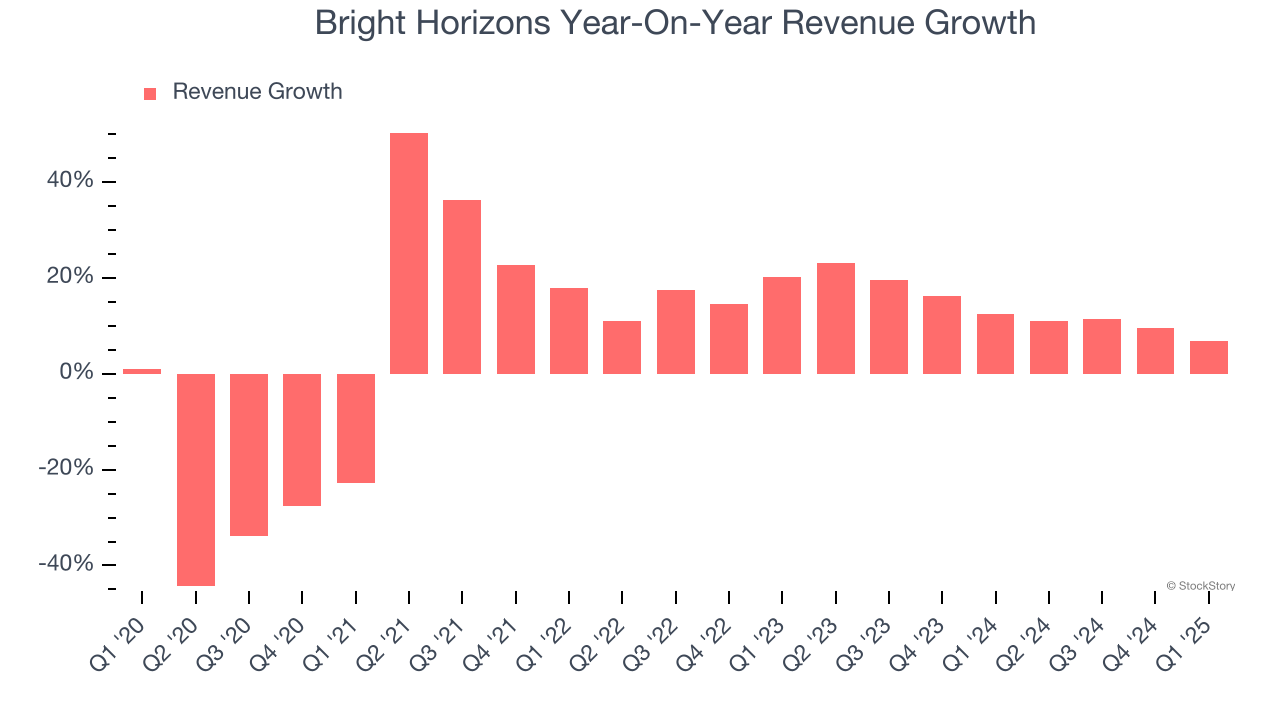
This quarter, Bright Horizons grew its revenue by 6.9% year on year, and its $665.5 million of revenue was in line with Wall Street’s estimates.
Looking ahead, sell-side analysts expect revenue to grow 7.2% over the next 12 months, a deceleration versus the last two years. This projection is underwhelming and suggests its products and services will see some demand headwinds.
Today’s young investors won’t have read the timeless lessons in Gorilla Game: Picking Winners In High Technology because it was written more than 20 years ago when Microsoft and Apple were first establishing their supremacy. But if we apply the same principles, then enterprise software stocks leveraging their own generative AI capabilities may well be the Gorillas of the future. So, in that spirit, we are excited to present our Special Free Report on a profitable, fast-growing enterprise software stock that is already riding the automation wave and looking to catch the generative AI next.
Operating Margin
Operating margin is an important measure of profitability as it shows the portion of revenue left after accounting for all core expenses – everything from the cost of goods sold to advertising and wages. It’s also useful for comparing profitability across companies with different levels of debt and tax rates because it excludes interest and taxes.
Bright Horizons’s operating margin has risen over the last 12 months and averaged 8.6% over the last two years. The company’s higher efficiency is a breath of fresh air, but its suboptimal cost structure means it still sports mediocre profitability for a consumer discretionary business.
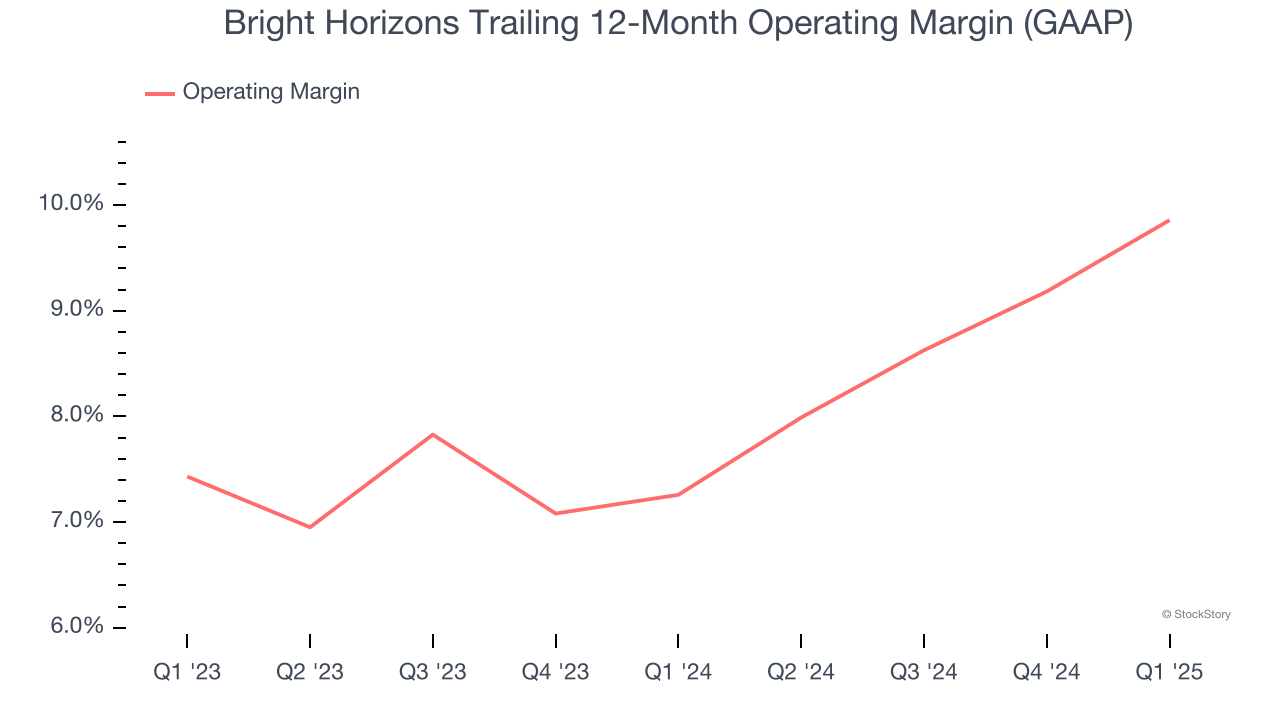
This quarter, Bright Horizons generated an operating profit margin of 9.4%, up 2.9 percentage points year on year. This increase was a welcome development and shows it was more efficient.
Earnings Per Share
Revenue trends explain a company’s historical growth, but the long-term change in earnings per share (EPS) points to the profitability of that growth – for example, a company could inflate its sales through excessive spending on advertising and promotions.
Bright Horizons’s flat EPS over the last five years was below its 5.7% annualized revenue growth. However, its operating margin didn’t change during this time, telling us that non-fundamental factors such as interest and taxes affected its ultimate earnings.
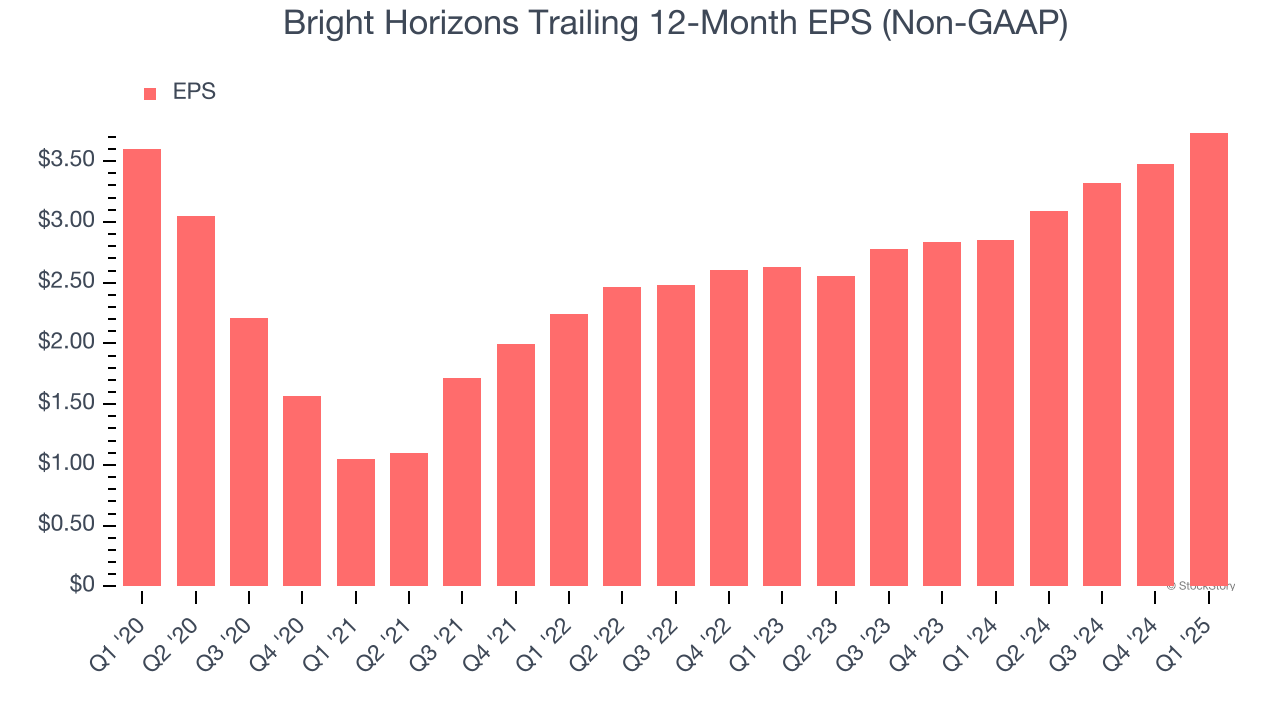
In Q1, Bright Horizons reported EPS at $0.77, up from $0.51 in the same quarter last year. This print easily cleared analysts’ estimates, and shareholders should be content with the results. Over the next 12 months, Wall Street expects Bright Horizons’s full-year EPS of $3.74 to grow 11.5%.
Key Takeaways from Bright Horizons’s Q1 Results
We enjoyed seeing Bright Horizons beat analysts’ EPS expectations this quarter. We were also happy its EBITDA outperformed Wall Street’s estimates. Overall, this print had some key positives. The stock remained flat at $127.30 immediately following the results.
Should you buy the stock or not? When making that decision, it’s important to consider its valuation, business qualities, as well as what has happened in the latest quarter. We cover that in our actionable full research report which you can read here, it’s free.


