Property and casualty insurer The Hanover Insurance Group (NYSE: THG) fell short of the market’s revenue expectations in Q3 2026 as revenue rose 3.7% year on year to $1.74 billion. Its non-GAAP profit of $5.15 per share was 11.2% above analysts’ consensus estimates.
For more on The Hanover Insurance Group, read our full research report, available free.
The Hanover Insurance Group (THG) Q3 2026 highlights:
- Net premiums earned $1.61 billion vs analysts’ consensus estimates of $1.62 billion (3.9% year-on-year growth, 0.6% miss)
- Revenue $1.74 billion vs S&P analysts’ consensus estimates of $1.75 billion (3.7% year-on-year growth, 0.9% miss)
- Combined ratio 92.3% vs analysts’ consensus estimates of 93.3% (102.5 basis point beat)
- Adjusted EPS $5.15 vs S&P analysts’ consensus estimates of $4.63 (11.2% beat)
- Book value per share $99.69 (3.9% year-on-year growth)
- Market capitalization $8.21 billion
"In the third quarter, we continued to translate strategic clarity, disciplined execution and the breadth of our diversified franchise into exceptional performance," said John C. Roche, president and chief executive officer at The Hanover. "With operating return on equity of 18.7% and record third quarter operating earnings per share of $5.15, our results reflect excellent underwriting execution and the benefits of our past portfolio actions. Our business mix continues to support strong performance and stable renewal pricing. A differentiated Specialty business, a preferred Personal Lines franchise, and a leading position with the top-performing agents in Core Commercial continue to provide avenues for profitable growth across market conditions, while we remain patient where conditions warrant greater selectivity," added Roche. "At the same time, we continue to invest in technology, AI and other capabilities that are delivering meaningful business impact and strengthening our future position. We are confident in our outlook, and our goal of long-term profitability and value creation will continue to guide every underwriting and growth decision we make."
Revenue growth
Big picture, insurers generate revenue from three key sources. The first is the core business of underwriting policies. The second source is income from investing the “float” (premiums collected upfront not yet paid out as claims) in assets such as fixed-income assets and equities. The third is fees from various sources such as policy administration, annuities or other value-added services. The Hanover Insurance Group’s revenue grew at a mediocre 6.5% annualized rate over the last five years, falling short of the insurance sector benchmark.
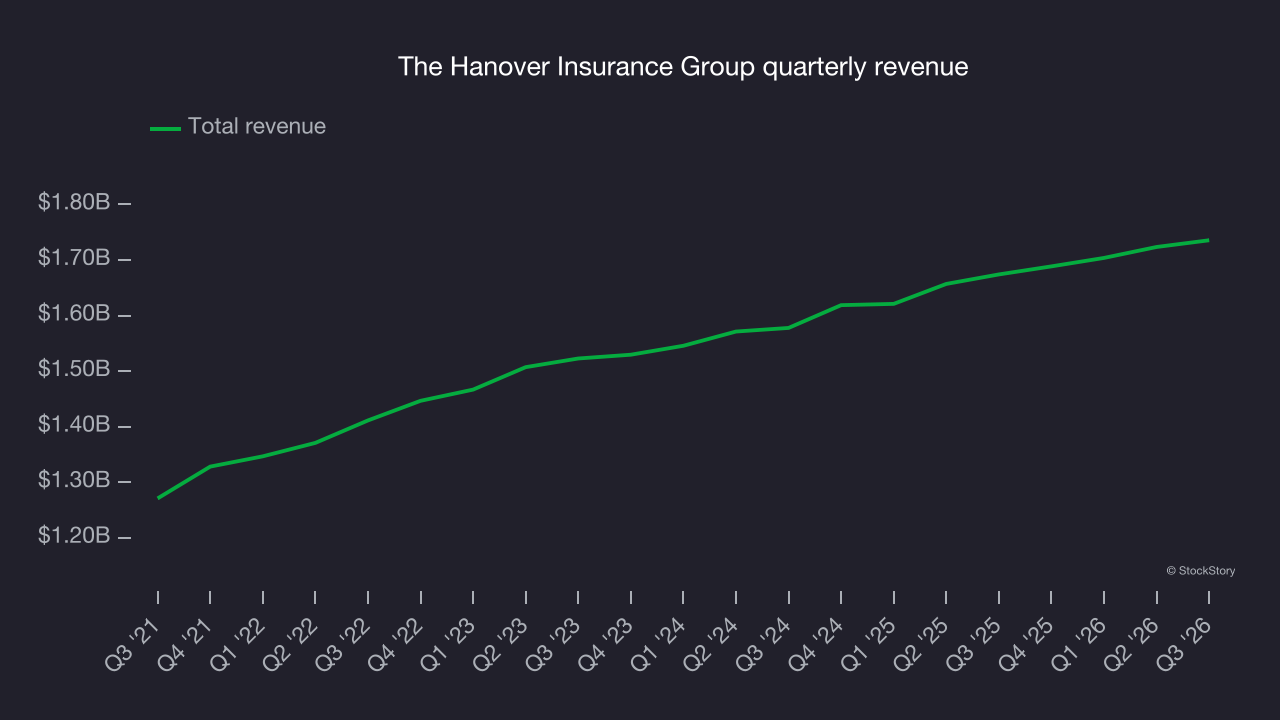
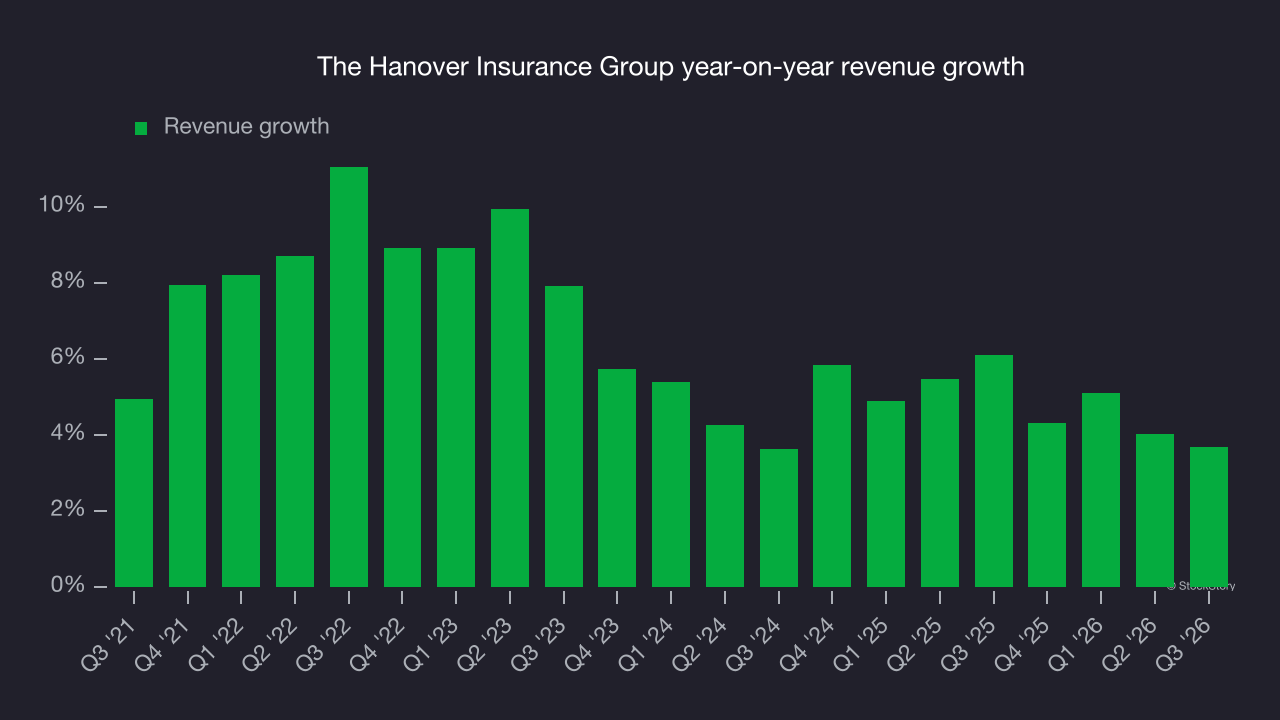
This quarter, The Hanover Insurance Group’s revenue grew by 3.7% year on year to $1.74 billion, falling short of Wall Street’s consensus estimates.
Net premiums earned made up 93.4% of the company’s total revenue during the last five years, meaning The Hanover Insurance Group depends heavily on its underwriting activities because non-insurance operations contribute little to revenue.
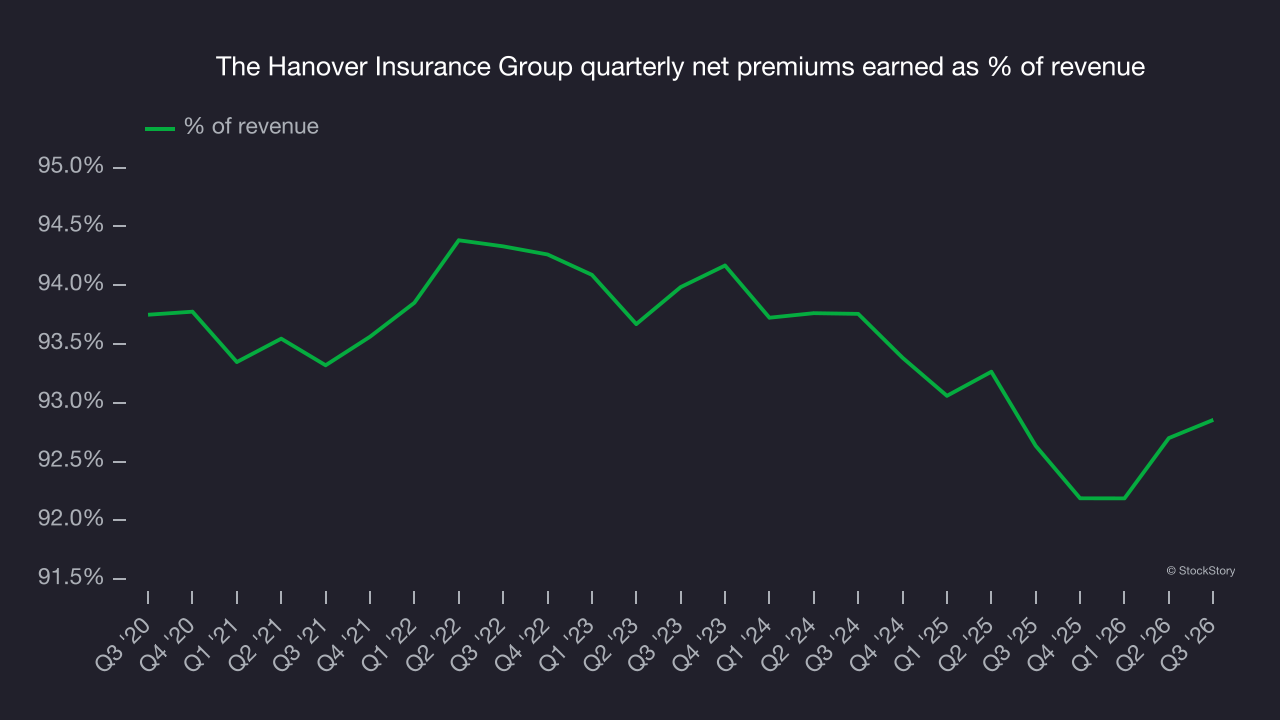
The market focuses primarily on an insurer’s net premiums earned growth as investment and fee income are considered more susceptible to market volatility and economic cycles.
Book value per share (BVPS)
Insurers are balance sheet businesses, collecting premiums upfront and paying out claims over time. Premiums collected but not yet paid out, often referred to as the float, are invested and create an asset base supported by a liability structure. Book value per share (BVPS) captures this dynamic by measuring these assets (investment portfolio, cash and reinsurance recoverables) less liabilities (claim reserves, debt and future policy benefits). BVPS is essentially the residual value for shareholders.
BVPS is therefore an important metric to track for insurers and sheds light on business quality because it reflects long-term capital growth and is harder to manipulate than more commonly used metrics like EPS.
The Hanover Insurance Group’s BVPS grew at a sluggish 2.7% annual rate over the last five years. However, BVPS growth has accelerated recently, growing by 11.7% annually over the last two years from $79.94 to $99.69 per share.
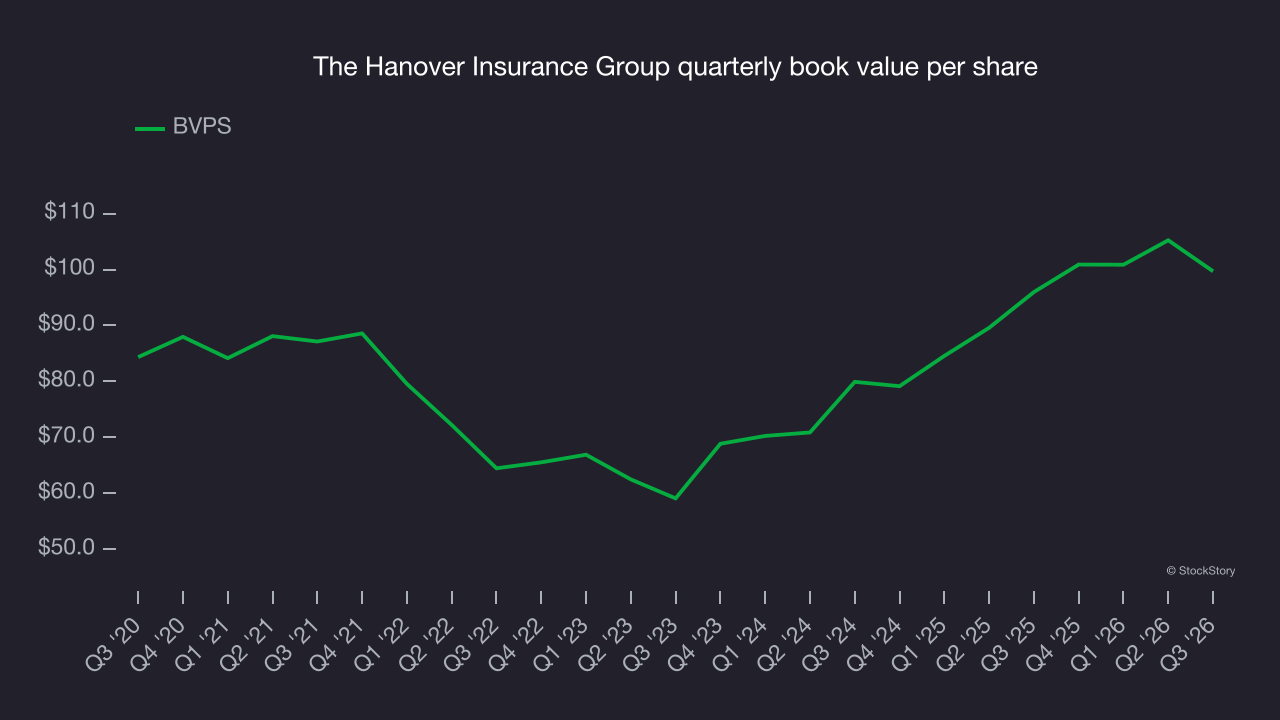
Over the next 12 months, consensus estimates call for The Hanover Insurance Group’s BVPS to grow by 43.8% to $115.94, a strong growth rate.
Key takeaways from The Hanover Insurance Group’s Q3 results
While The Hanover Insurance Group beat adjusted EPS, revenue fell slightly short of Wall Street’s consensus, leaving the quarter results mixed. Shares rose 3.2% to $240.70 immediately after the report.
When evaluating The Hanover Insurance Group, consider the bigger picture of valuation and business quality as well as the latest earnings. For more on these factors, read the full research report here (it’s free).