Medical technology company Becton, Dickinson and Company (NYSE: BDX) reported Q4 CY2025 results beating Wall Street’s revenue expectations, with sales up 1.6% year on year to $5.25 billion. Its non-GAAP profit of $2.91 per share was 3.5% above analysts’ consensus estimates.
Is now the time to buy BD? Find out by accessing our full research report, it’s free.
BD (BDX) Q4 CY2025 Highlights:
- Revenue: $5.25 billion vs analyst estimates of $5.15 billion (1.6% year-on-year growth, 2.1% beat)
- Adjusted EPS: $2.91 vs analyst estimates of $2.81 (3.5% beat)
- Management lowered its full-year Adjusted EPS guidance to $12.50 at the midpoint, a 16.1% decrease
- Operating Margin: 10.5%, up from 8.8% in the same quarter last year
- Free Cash Flow Margin: 10.5%, similar to the same quarter last year
- Constant Currency Revenue was flat year on year (9.6% in the same quarter last year)
- Market Capitalization: $59.84 billion
Company Overview
With a history dating back to 1897 and a presence in virtually every hospital around the globe, Becton Dickinson (NYSE: BDX) develops and manufactures medical supplies, devices, laboratory equipment and diagnostic products used by healthcare institutions and professionals worldwide.
Revenue Growth
A company’s long-term sales performance can indicate its overall quality. Any business can experience short-term success, but top-performing ones enjoy sustained growth for years. Over the last five years, BD grew its sales at a mediocre 4.4% compounded annual growth rate. This fell short of our benchmark for the healthcare sector and is a tough starting point for our analysis.
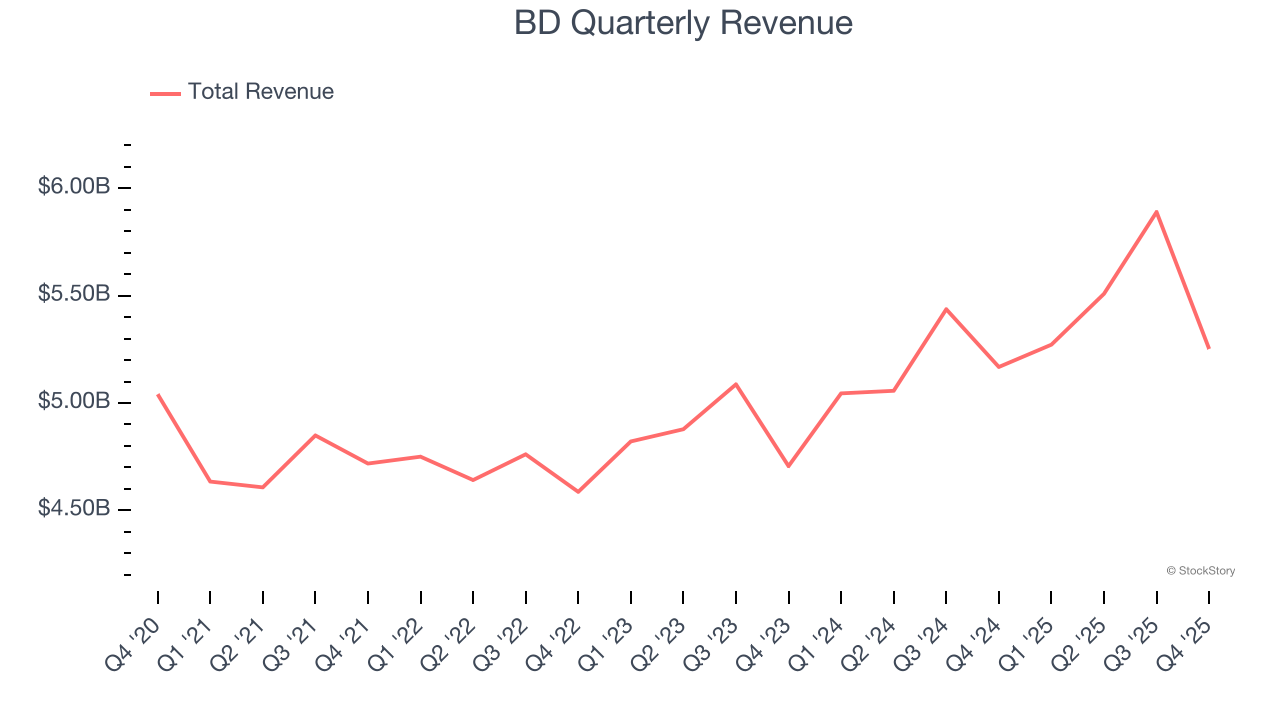
We at StockStory place the most emphasis on long-term growth, but within healthcare, a half-decade historical view may miss recent innovations or disruptive industry trends. BD’s annualized revenue growth of 6.1% over the last two years is above its five-year trend, but we were still disappointed by the results. 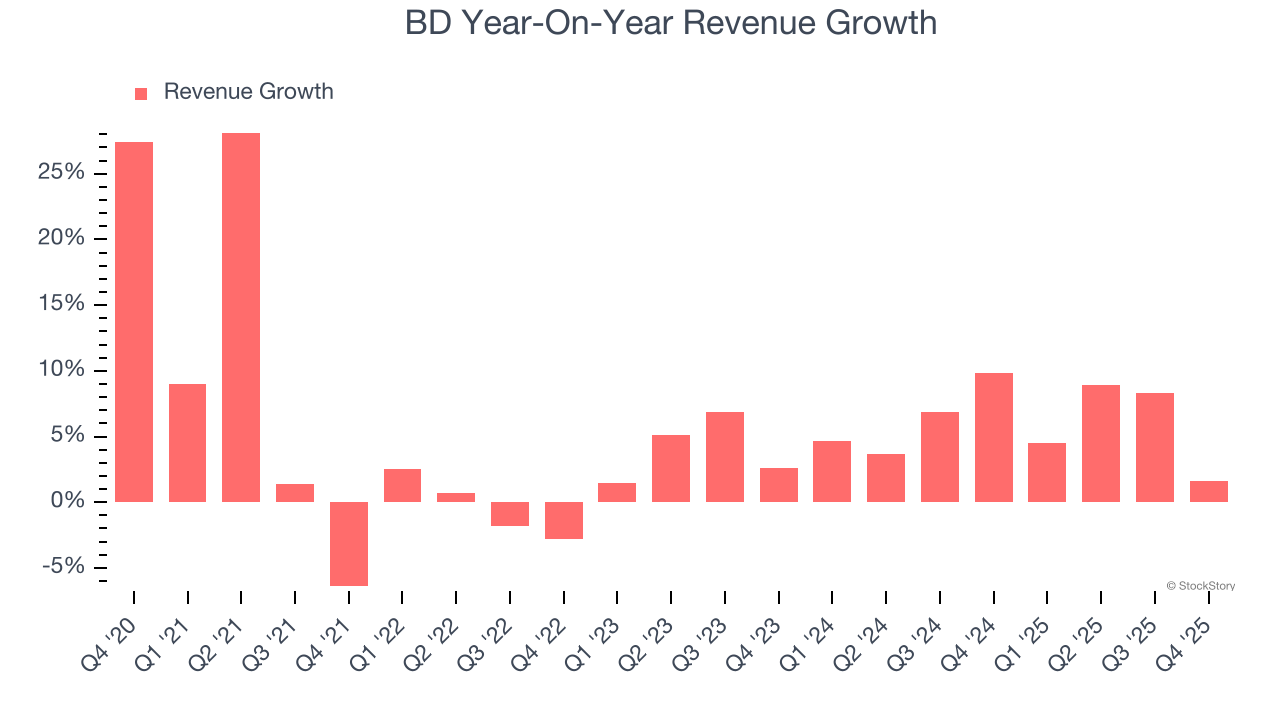
We can dig further into the company’s sales dynamics by analyzing its constant currency revenue, which excludes currency movements that are outside their control and not indicative of demand. Over the last two years, its constant currency sales averaged 5.8% year-on-year growth. Because this number aligns with its normal revenue growth, we can see that BD has properly hedged its foreign currency exposure. 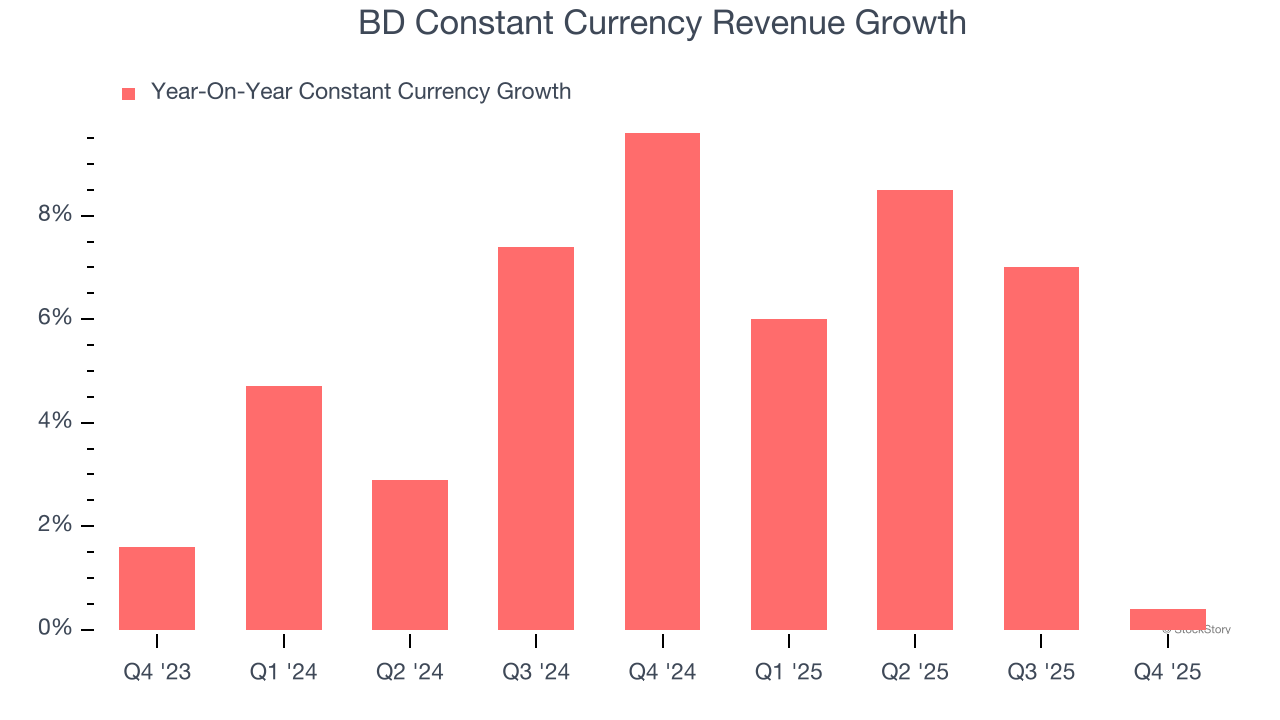
This quarter, BD reported modest year-on-year revenue growth of 1.6% but beat Wall Street’s estimates by 2.1%.
Looking ahead, sell-side analysts expect revenue to grow 1.6% over the next 12 months, a deceleration versus the last two years. This projection doesn't excite us and indicates its products and services will see some demand headwinds.
Microsoft, Alphabet, Coca-Cola, Monster Beverage—all began as under-the-radar growth stories riding a massive trend. We’ve identified the next one: a profitable AI semiconductor play Wall Street is still overlooking. Go here for access to our full report.
Operating Margin
BD has done a decent job managing its cost base over the last five years. The company has produced an average operating margin of 11.3%, higher than the broader healthcare sector.
Analyzing the trend in its profitability, BD’s operating margin rose by 1.6 percentage points over the last five years, as its sales growth gave it operating leverage. The company’s two-year trajectory shows its performance was mostly driven by its recent improvements.
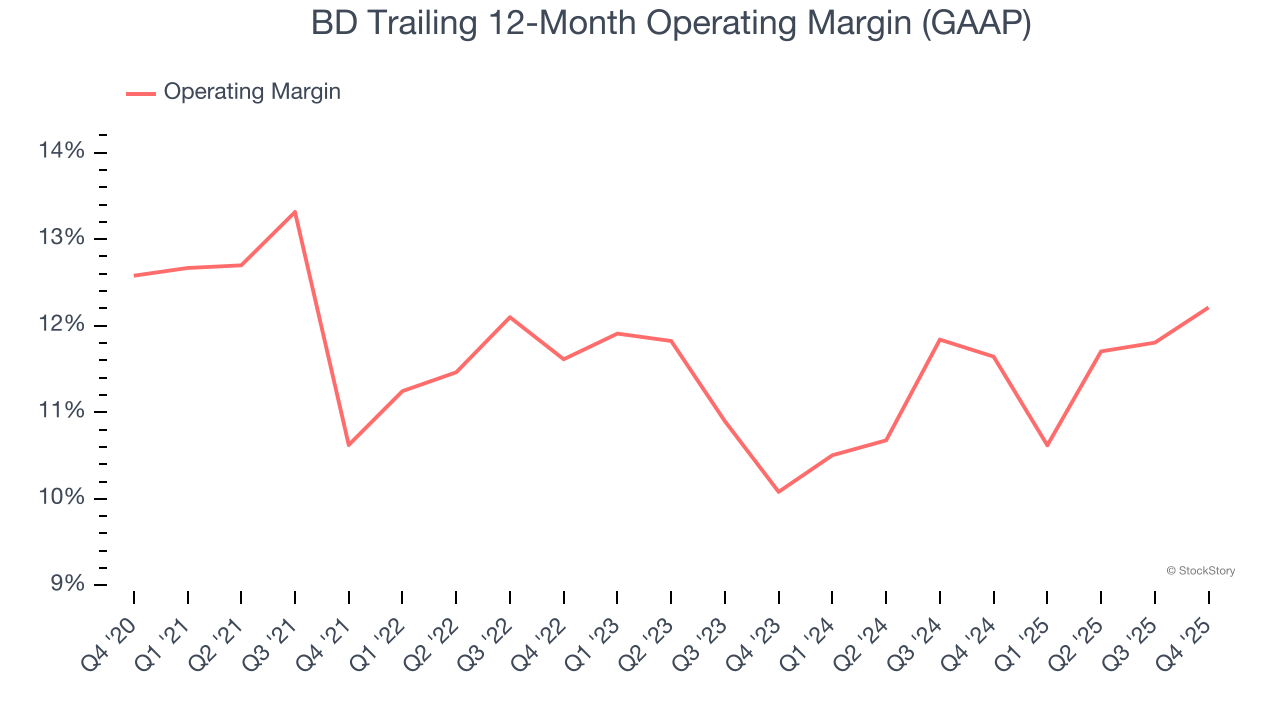
This quarter, BD generated an operating margin profit margin of 10.5%, up 1.7 percentage points year on year. This increase was a welcome development and shows it was more efficient.
Earnings Per Share
We track the long-term change in earnings per share (EPS) for the same reason as long-term revenue growth. Compared to revenue, however, EPS highlights whether a company’s growth is profitable.
BD’s unimpressive 2.8% annual EPS growth over the last five years aligns with its revenue performance. On the bright side, this tells us its incremental sales were profitable.
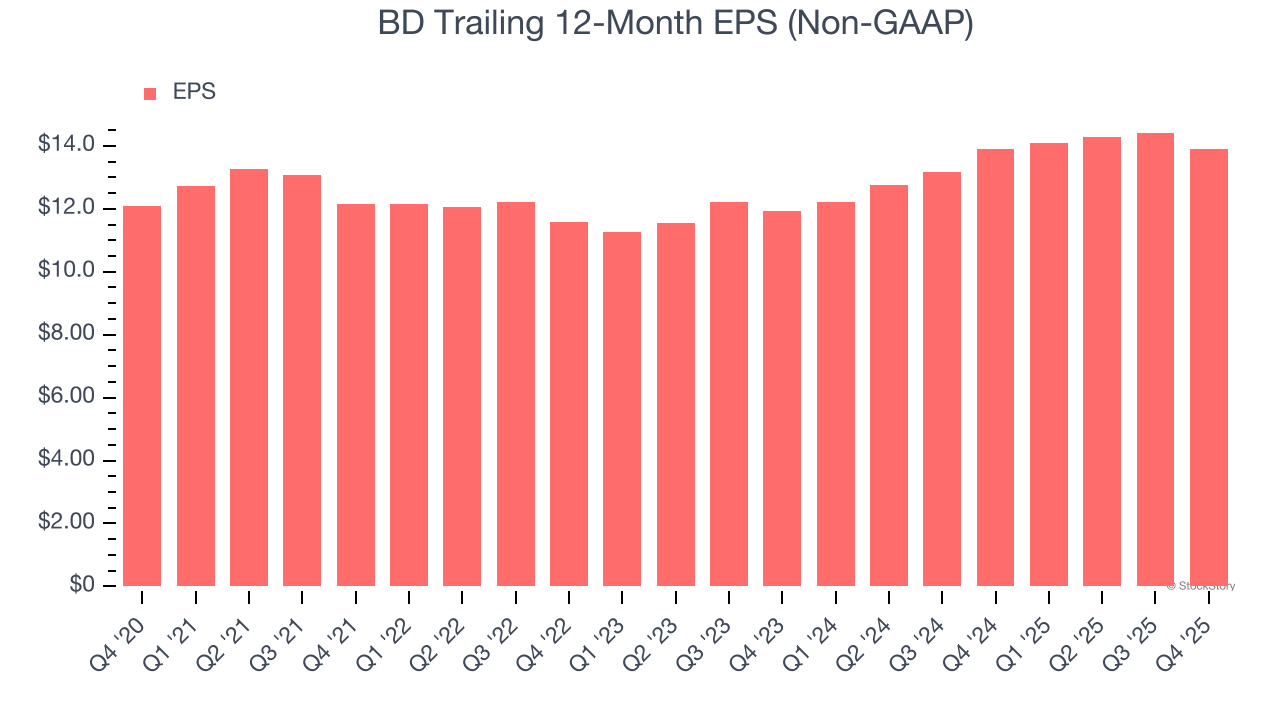
In Q4, BD reported adjusted EPS of $2.91, down from $3.43 in the same quarter last year. Despite falling year on year, this print beat analysts’ estimates by 3.5%. Over the next 12 months, Wall Street expects BD’s full-year EPS of $13.90 to grow 8.7%.
Key Takeaways from BD’s Q4 Results
It was encouraging to see BD beat analysts’ revenue expectations this quarter. We were also glad its EPS outperformed Wall Street’s estimates. On the other hand, its full-year EPS guidance missed. This guidance weighed on shares. The stock traded down 4.9% to $199.69 immediately following the results.
BD’s earnings report left more to be desired. Let’s look forward to see if this quarter has created an opportunity to buy the stock. The latest quarter does matter, but not nearly as much as longer-term fundamentals and valuation, when deciding if the stock is a buy. We cover that in our actionable full research report which you can read here (it’s free).