
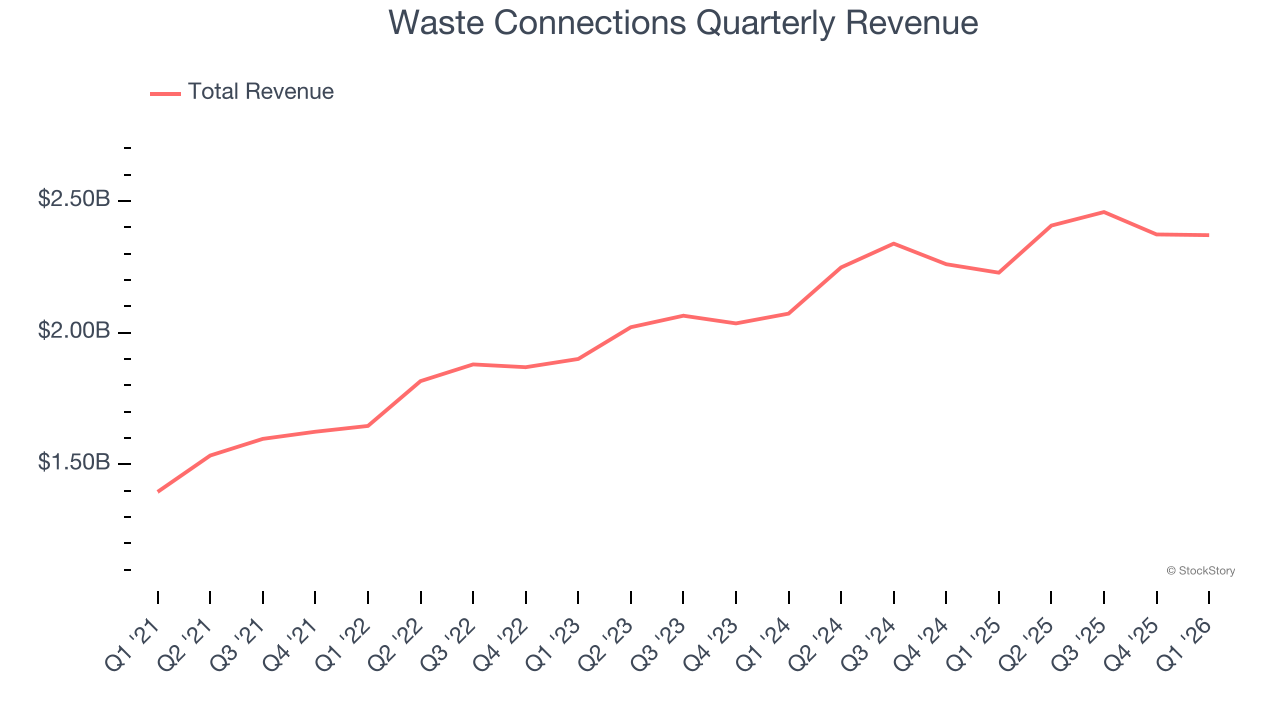
Waste management company Waste Connections (NYSE: WCN) reported revenue ahead of Wall Street’s expectations in Q1 CY2026, with sales up 6.4% year on year to $2.37 billion. Its non-GAAP profit of $1.23 per share was 3.8% above analysts’ consensus estimates.
Is now the time to buy Waste Connections? Find out by accessing our full research report, it’s free.
Waste Connections (WCN) Q1 CY2026 Highlights:
- Revenue: $2.37 billion vs analyst estimates of $2.35 billion (6.4% year-on-year growth, 0.8% beat)
- Adjusted EPS: $1.23 vs analyst estimates of $1.18 (3.8% beat)
- Adjusted EBITDA: $769.5 million vs analyst estimates of $760.2 million (32.5% margin, 1.2% beat)
- Operating Margin: 15.4%, down from 17.5% in the same quarter last year
- Free Cash Flow Margin: 10.5%, down from 14.8% in the same quarter last year
- Market Capitalization: $40.25 billion
Company Overview
Operating a network of municipal solid waste landfills in the U.S. and Canada, Waste Connections (NYSE: WCN) is North America's third-largest waste management company providing collection, disposal, and recycling services.
Revenue Growth
Reviewing a company’s long-term sales performance reveals insights into its quality. Any business can have short-term success, but a top-tier one grows for years. Thankfully, Waste Connections’s 11.8% annualized revenue growth over the last five years was impressive. Its growth beat the average industrials company and shows its offerings resonate with customers.
We at StockStory place the most emphasis on long-term growth, but within industrials, a half-decade historical view may miss cycles, industry trends, or a company capitalizing on catalysts such as a new contract win or a successful product line. Waste Connections’s annualized revenue growth of 8.3% over the last two years is below its five-year trend, but we still think the results were respectable. 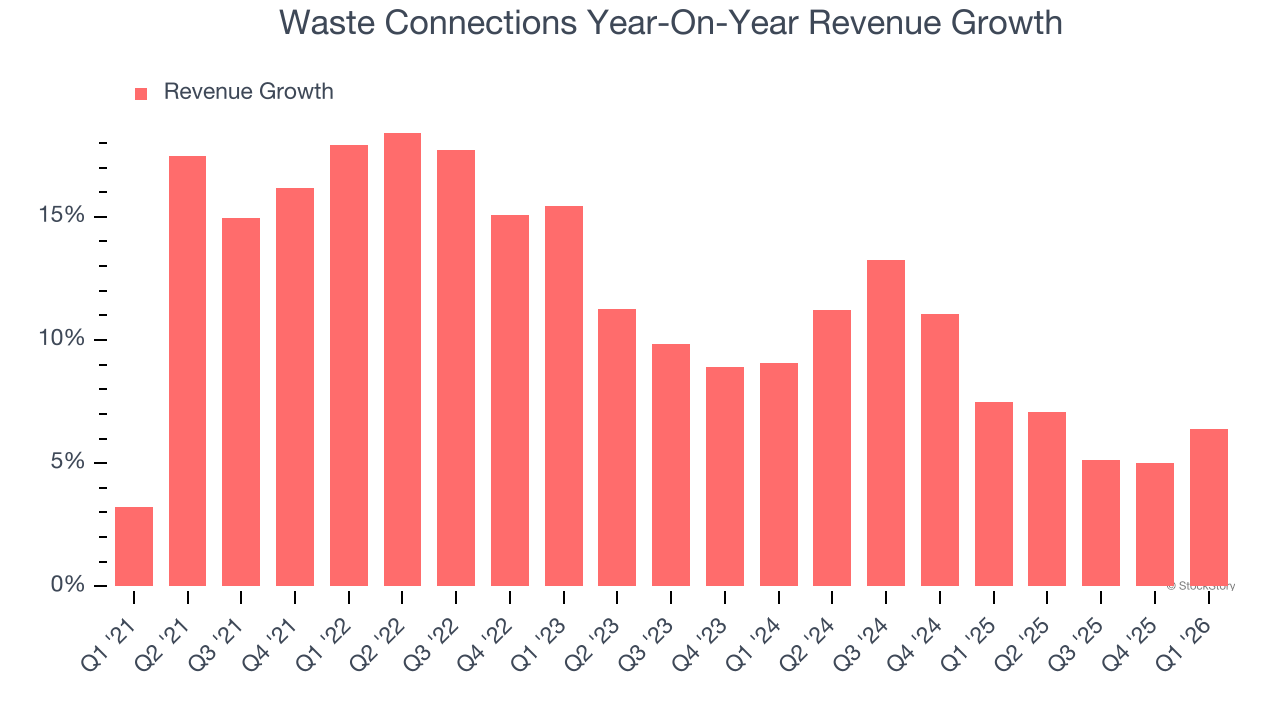
This quarter, Waste Connections reported year-on-year revenue growth of 6.4%, and its $2.37 billion of revenue exceeded Wall Street’s estimates by 0.8%.
Looking ahead, sell-side analysts expect revenue to grow 5% over the next 12 months, a deceleration versus the last two years. This projection is underwhelming and implies its products and services will face some demand challenges.
ONE MORE THING: The $21 AI Application Stock Wall Street Forgot. While Wall Street obsesses over who’s building AI, one company is already using it to print money. And nobody’s paying attention.
AI chip stocks trade at ridiculous valuations. This company processes a trillion consumer signals monthly using AI and trades at a third of the price. The gap won’t last. The institutions will figure it out. You need to see this first. Read the FREE Report Before They Notice.
Operating Margin
Waste Connections’s operating margin has risen over the last 12 months and averaged 15.8% over the last five years. On top of that, its profitability was elite for an industrials business thanks to its efficient cost structure and economies of scale. This result isn’t surprising as its high gross margin gives it a favorable starting point.
Looking at the trend in its profitability, Waste Connections’s operating margin might fluctuated slightly but has generally stayed the same over the last five years. This raises questions about the company’s expense base because its revenue growth should have given it leverage on its fixed costs, resulting in better economies of scale and profitability.
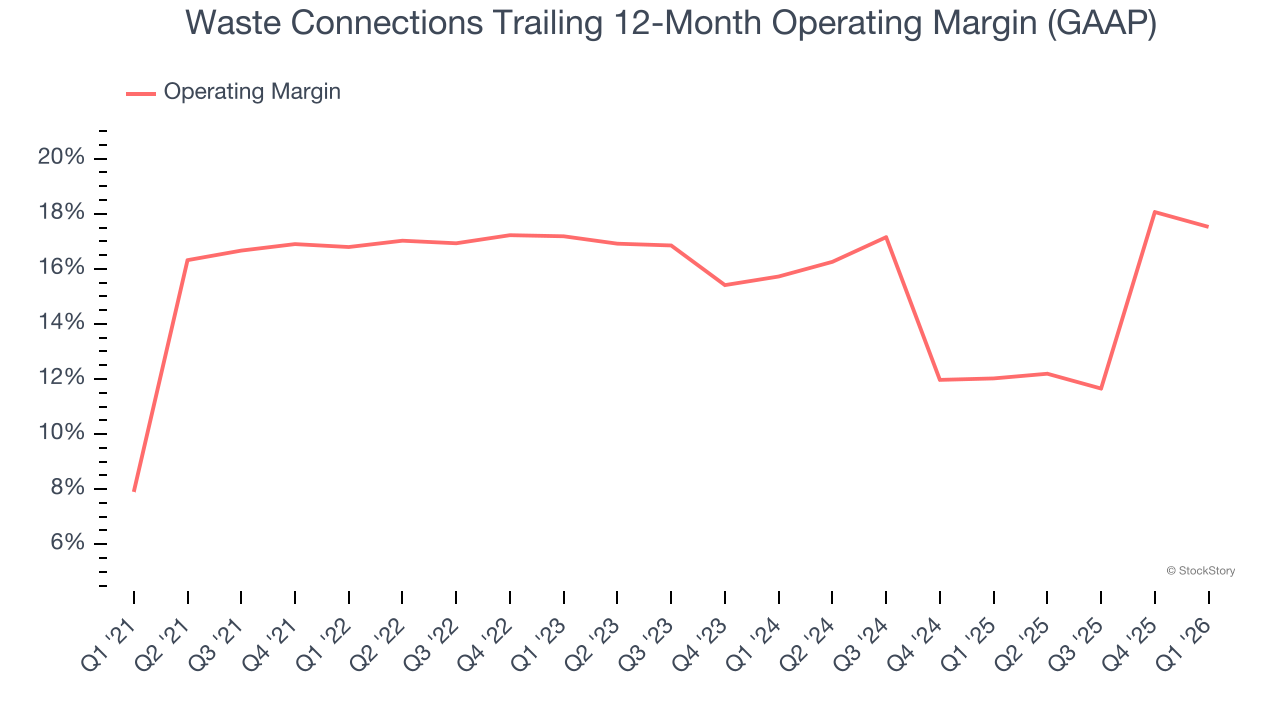
This quarter, Waste Connections generated an operating margin profit margin of 15.4%, down 2.2 percentage points year on year. Since Waste Connections’s operating margin decreased more than its gross margin, we can assume it was less efficient because expenses such as marketing, R&D, and administrative overhead increased.
Earnings Per Share
Revenue trends explain a company’s historical growth, but the long-term change in earnings per share (EPS) points to the profitability of that growth – for example, a company could inflate its sales through excessive spending on advertising and promotions.
Waste Connections’s EPS grew at 14.2% compounded annual growth rate over the last five years, higher than its 11.8% annualized revenue growth. However, this alone doesn’t tell us much about its business quality because its operating margin didn’t improve.
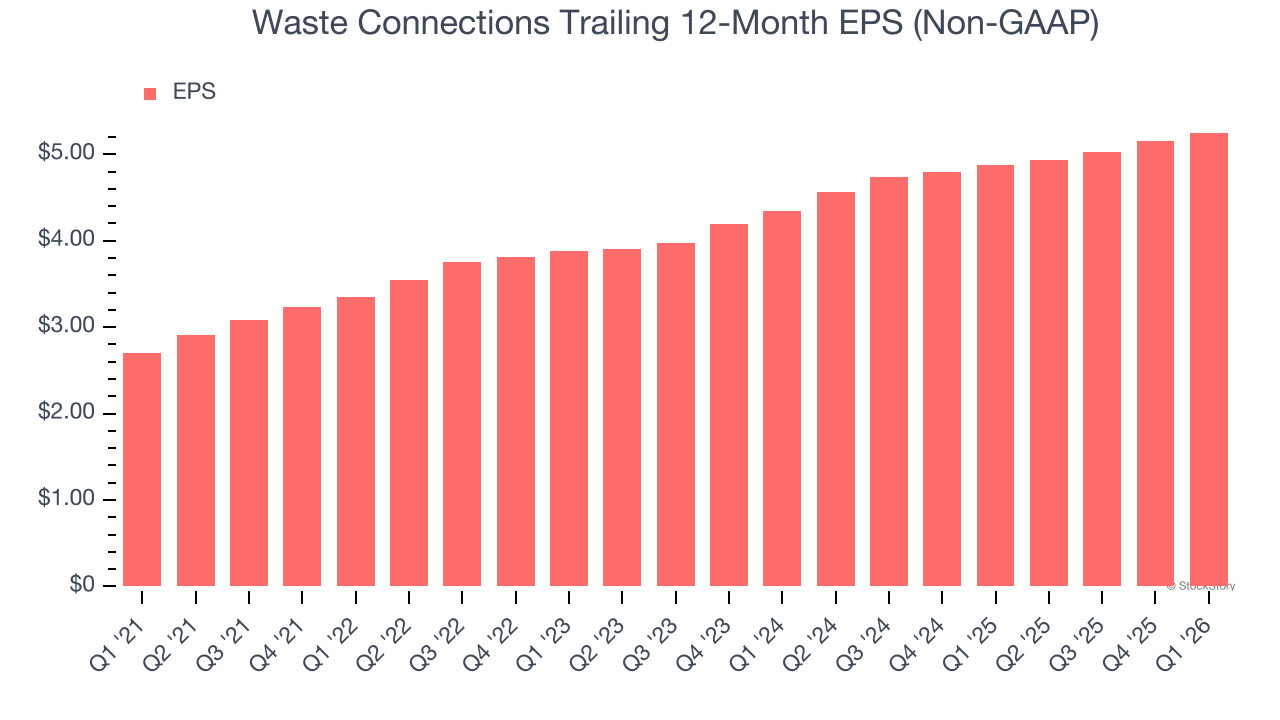
We can take a deeper look into Waste Connections’s earnings to better understand the drivers of its performance. A five-year view shows that Waste Connections has repurchased its stock, shrinking its share count by 2.8%. This tells us its EPS outperformed its revenue not because of increased operational efficiency but financial engineering, as buybacks boost per share earnings. 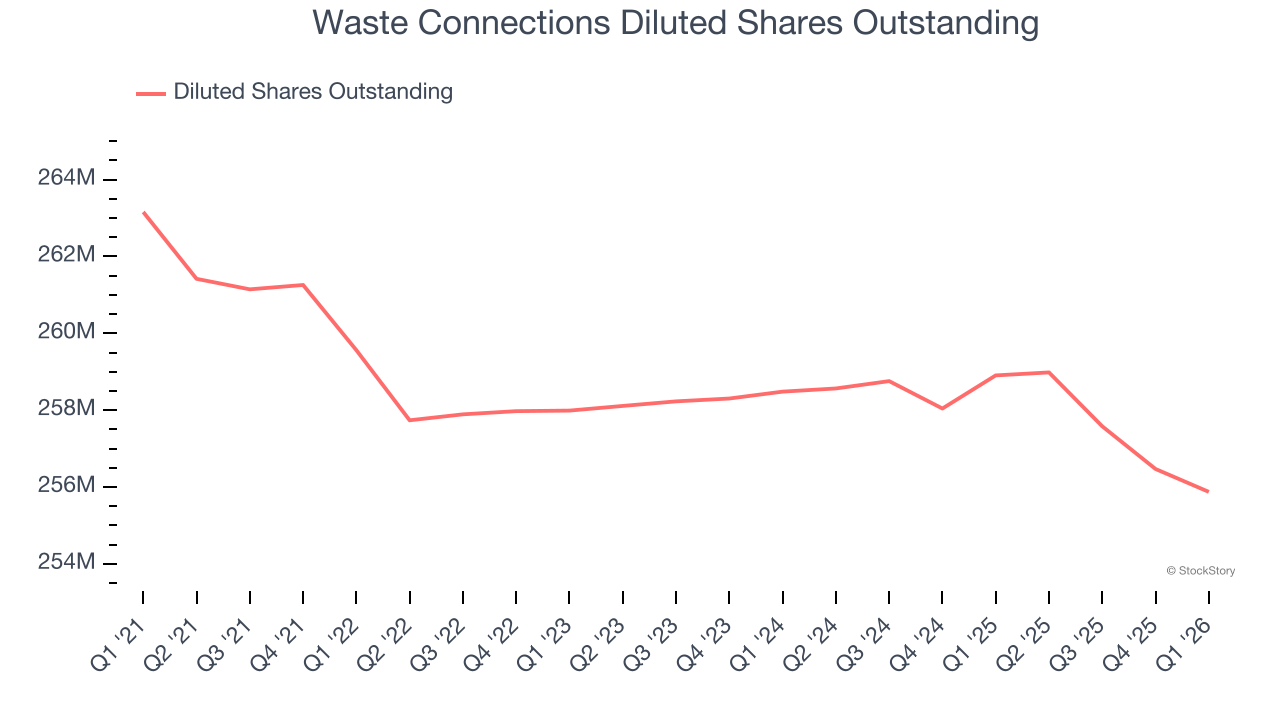
Like with revenue, we analyze EPS over a more recent period because it can provide insight into an emerging theme or development for the business.
For Waste Connections, its two-year annual EPS growth of 10% was lower than its five-year trend. We still think its growth was good and hope it can accelerate in the future.
In Q1, Waste Connections reported adjusted EPS of $1.23, up from $1.13 in the same quarter last year. This print beat analysts’ estimates by 3.8%. Over the next 12 months, Wall Street expects Waste Connections’s full-year EPS of $5.25 to grow 6.7%.
Key Takeaways from Waste Connections’s Q1 Results
It was good to see Waste Connections narrowly top analysts’ revenue expectations this quarter. We were also happy its EBITDA narrowly outperformed Wall Street’s estimates. On the other hand, its adjusted operating income missed. Overall, this was a softer quarter. The stock traded up 2.6% to $160.45 immediately after reporting.
Should you buy the stock or not? What happened in the latest quarter matters, but not as much as longer-term business quality and valuation, when deciding whether to invest in this stock. We cover that in our actionable full research report which you can read here (it’s free).