What a time it’s been for Solaris Energy Infrastructure. In the past six months alone, the company’s stock price has increased by a massive 40.5%, setting a new 52-week high of $75.09 per share. This was partly thanks to its solid quarterly results, and the run-up might have investors contemplating their next move.
Is there a buying opportunity in Solaris Energy Infrastructure, or does it present a risk to your portfolio? Get the full stock story straight from our expert analysts, it’s free.
Why Is Solaris Energy Infrastructure Not Exciting?
We’re happy investors have made money, but we don't have much confidence in Solaris Energy Infrastructure. Here are three reasons we avoid SEI and a stock we'd rather own.
1. Fewer Distribution Channels Limit its Ceiling
The scale of a company’s revenue base is an important lens through which to view the topline, as it signals whether a producer has gone from a vulnerable commodity taker into a durable operating platform. Larger producers generate revenue across many wells, pads, takeaway routes, and geographies rather than relying on a single field or drilling program.
Solaris Energy Infrastructure’s $692.1 million of revenue in the last year is pretty small for the industry, suggesting the company hasn’t hit a level of diversification where investors can sleep easy at night.
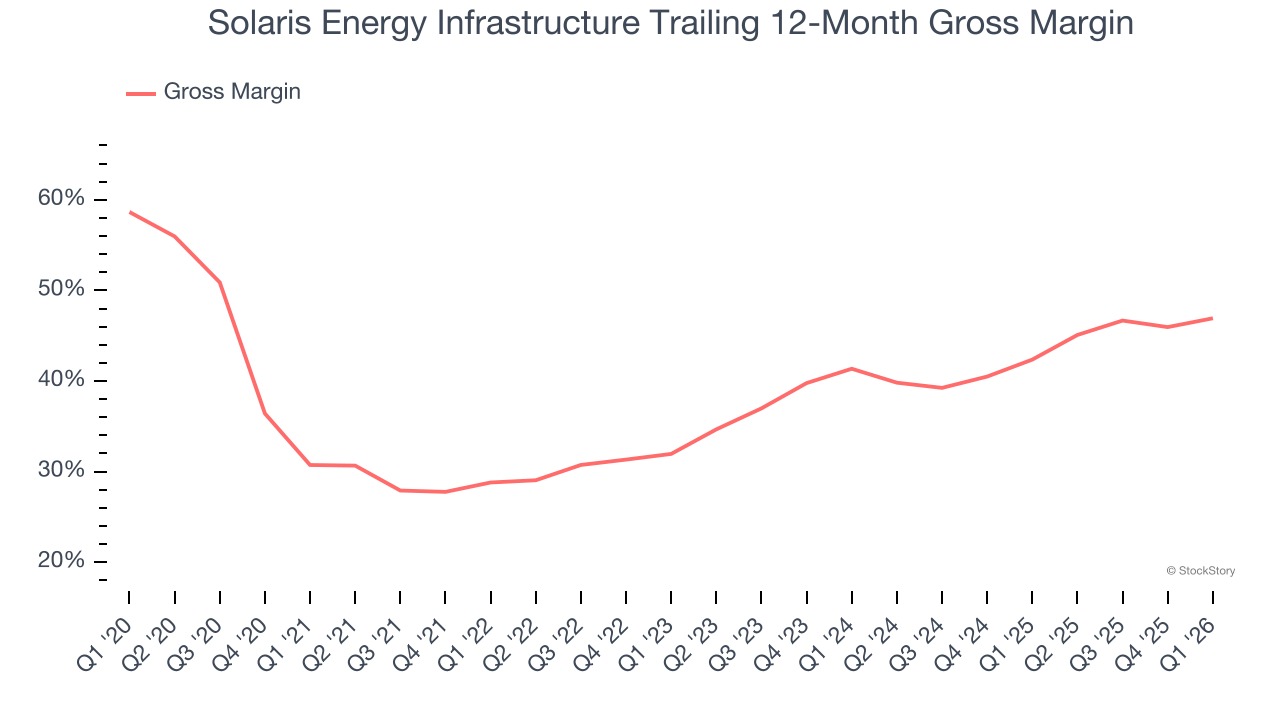
2. Low Gross Margin Hinders Flexibility
While energy gross margins can be distorted by commodity prices, hedging, and short-term cost swings, sustained margins across a full cycle reflect a producer’s underlying asset quality, infrastructure position, and cost structure.
Solaris Energy Infrastructure, which averaged 40.6% gross margin over the last five years, exhibits subpar unit economics in the sector. It means the company will struggle more at lower commodity prices than peers with better gross margins.
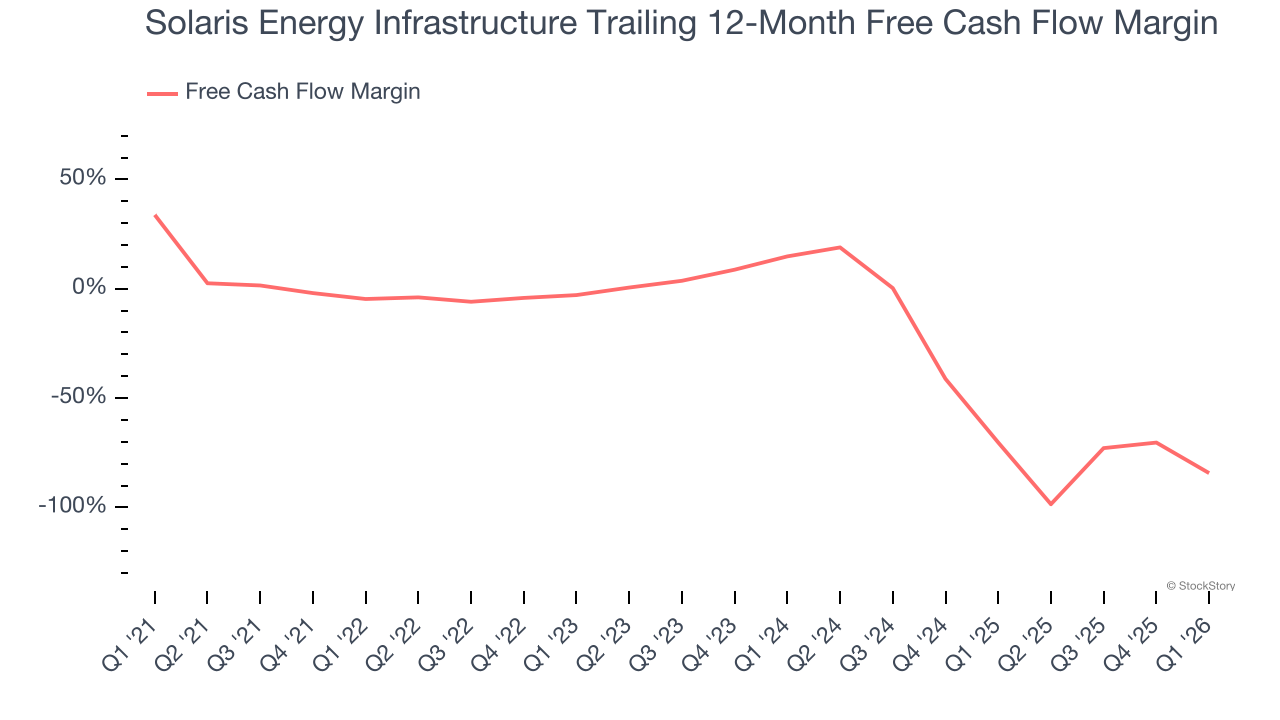
3. Cash Burn Ignites Concerns
If you’ve followed StockStory for a while, you know we emphasize free cash flow. Why, you ask? We believe that in the end, cash is king, and you can’t use accounting profits to pay the bills.
Solaris Energy Infrastructure’s demanding reinvestments have drained its resources over the last five years, putting it in a pinch and limiting its ability to return capital to investors. Its free cash flow margin averaged negative 43.9%, meaning it lit $43.85 of cash on fire for every $100 in revenue.
Final Judgment
Solaris Energy Infrastructure’s business quality ultimately falls short of our standards. Following the recent surge, the stock trades at 54.8× forward P/E (or $75.09 per share). This multiple tells us a lot of good news is priced in - we think there are better opportunities elsewhere. We’d recommend looking at one of Charlie Munger’s all-time favorite businesses.
High-Quality Stocks for All Market Conditions
ALSO WORTH WATCHING: Top 5 Momentum Stocks. The best time to own a great stock is when the market is finally noticing it. These aren't just high-quality businesses. Something is happening with them right now. Elite fundamentals meeting near-term momentum - both boxes checked at the same time.
Find out which stocks our AI platform is flagging this week. See this week's Strong Momentum stocks - FREE. Get Our Strong Momentum Stocks for Free HERE.
Stocks that have made our list include now familiar names such as Nvidia (+1,326% between June 2020 and June 2025) as well as under-the-radar businesses like the once-micro-cap company Tecnoglass (+1,754% five-year return). Find your next big winner with StockStory today.