Home appliances manufacturer Whirlpool (NYSE: WHR) missed Wall Street’s revenue expectations in Q1 CY2026, with sales falling 9.6% year on year to $3.27 billion. The company’s full-year revenue guidance of $15 billion at the midpoint came in 1.8% below analysts’ estimates. Its GAAP loss of $1.43 per share was significantly below analysts’ consensus estimates.
Is now the time to buy Whirlpool? Find out by accessing our full research report, it’s free.
Whirlpool (WHR) Q1 CY2026 Highlights:
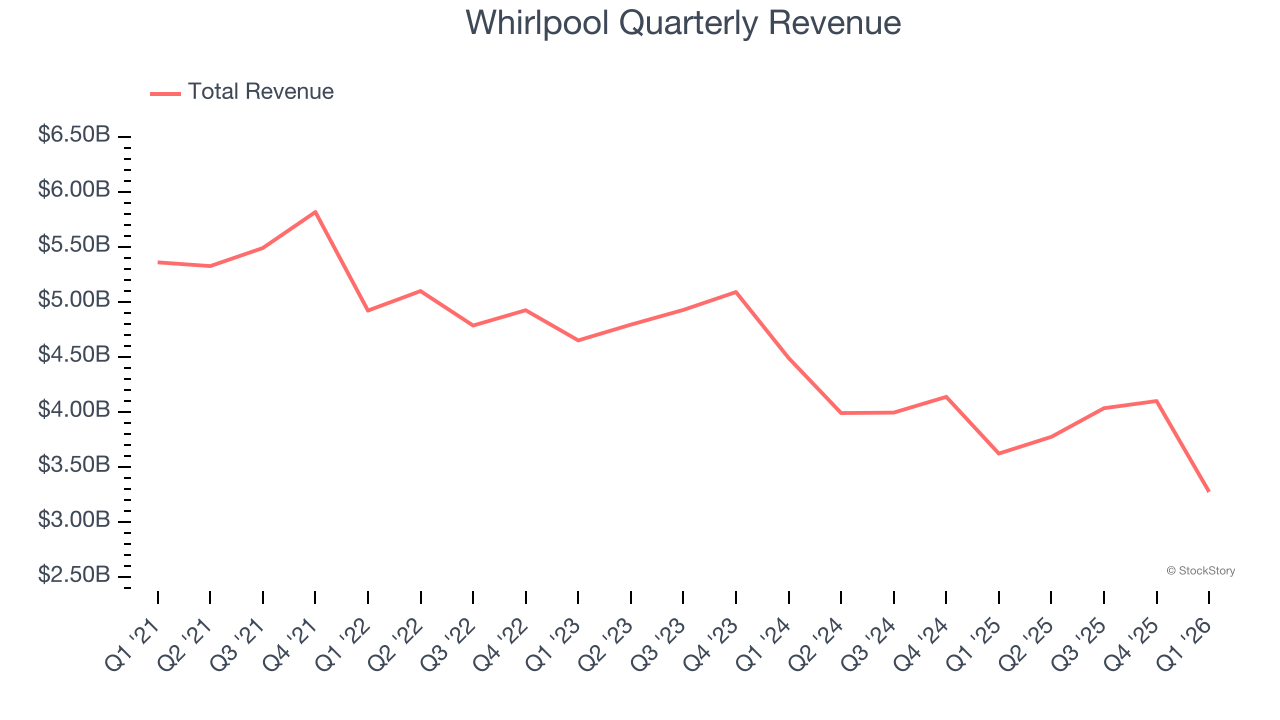
- Revenue: $3.27 billion vs analyst estimates of $3.42 billion (9.6% year-on-year decline, 4.4% miss)
- EPS (GAAP): -$1.43 vs analyst estimates of $0.39 (significant miss)
- Adjusted EBITDA: $117 million vs analyst estimates of $195.4 million (3.6% margin, 40.1% miss)
- The company dropped its revenue guidance for the full year to $15 billion at the midpoint from $15.45 billion, a 2.9% decrease
- Operating Margin: 0.5%, down from 5.1% in the same quarter last year
- Free Cash Flow was -$895 million compared to -$793 million in the same quarter last year
- Market Capitalization: $3.49 billion
"We acted decisively to address pricing and costs in the face of rapid deterioration in macroeconomic conditions. Now, with Section 232 changes in favor of domestic manufacturers, Whirlpool Corporation is structurally positioned to win with our American-made products."
Company Overview
Credited with introducing the first automatic washing machine, Whirlpool (NYSE: WHR) is a manufacturer of a variety of home appliances.
Revenue Growth
Reviewing a company’s long-term sales performance reveals insights into its quality. Any business can put up a good quarter or two, but many enduring ones grow for years. Over the last five years, Whirlpool’s demand was weak and its revenue declined by 5.8% per year. This was below our standards and is a sign of poor business quality.
Long-term growth is the most important, but within industrials, a half-decade historical view may miss new industry trends or demand cycles. Whirlpool’s recent performance shows its demand remained suppressed as its revenue has declined by 11.3% annually over the last two years. 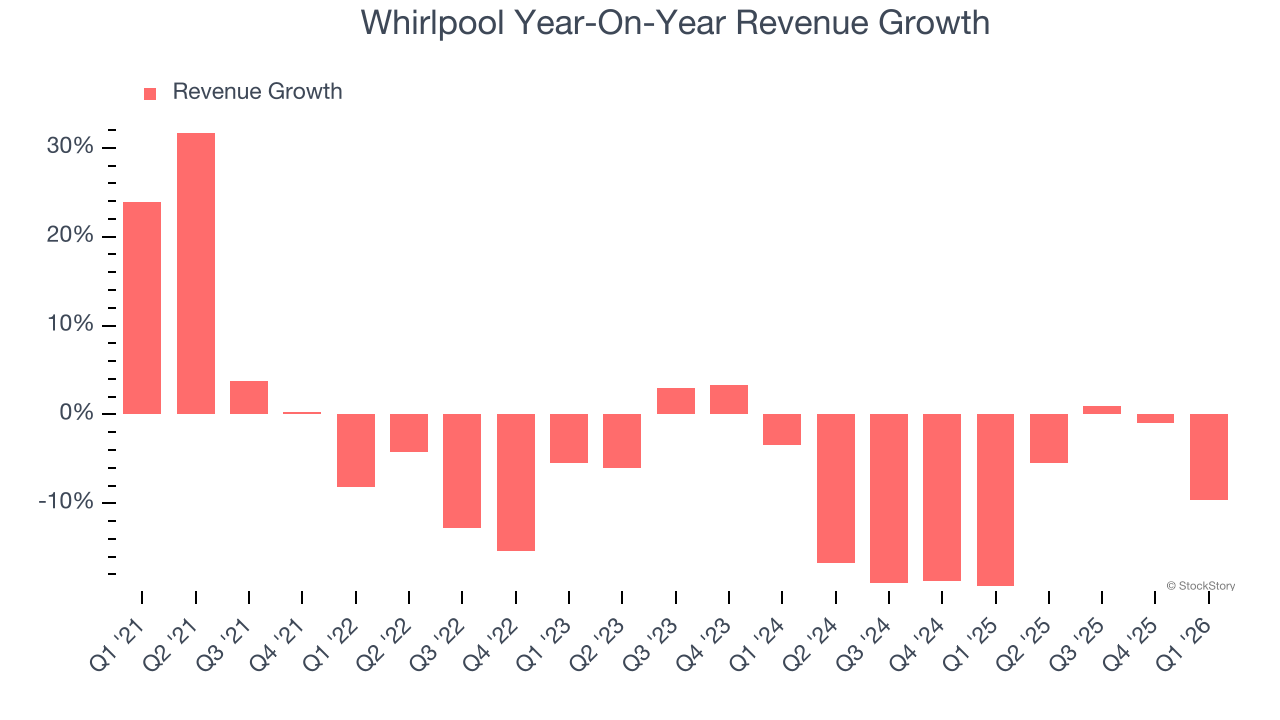
This quarter, Whirlpool missed Wall Street’s estimates and reported a rather uninspiring 9.6% year-on-year revenue decline, generating $3.27 billion of revenue.
Looking ahead, sell-side analysts expect revenue to grow 1.1% over the next 12 months. Although this projection implies its newer products and services will catalyze better top-line performance, it is still below the sector average.
ALSO WORTH WATCHING: Nvidia’s Quiet Partner. Nvidia’s chips cost a hundred grand. The connectors that make them work cost even more. One company makes them all.
Every AI server needs specialized infrastructure the chip companies don’t make. High-speed cables. Power connectors. Thermal sensors. This 90-year-old company built a monopoly on it. The AI boom just started. This stock is still flying under the radar. Claim The Stock Ticker Here for FREE.
Operating Margin
Whirlpool was profitable over the last five years but held back by its large cost base. Its average operating margin of 2.9% was weak for an industrials business. This result isn’t too surprising given its low gross margin as a starting point.
Looking at the trend in its profitability, Whirlpool’s operating margin decreased by 5.7 percentage points over the last five years. Whirlpool’s performance was poor no matter how you look at it - it shows that costs were rising and it couldn’t pass them onto its customers.
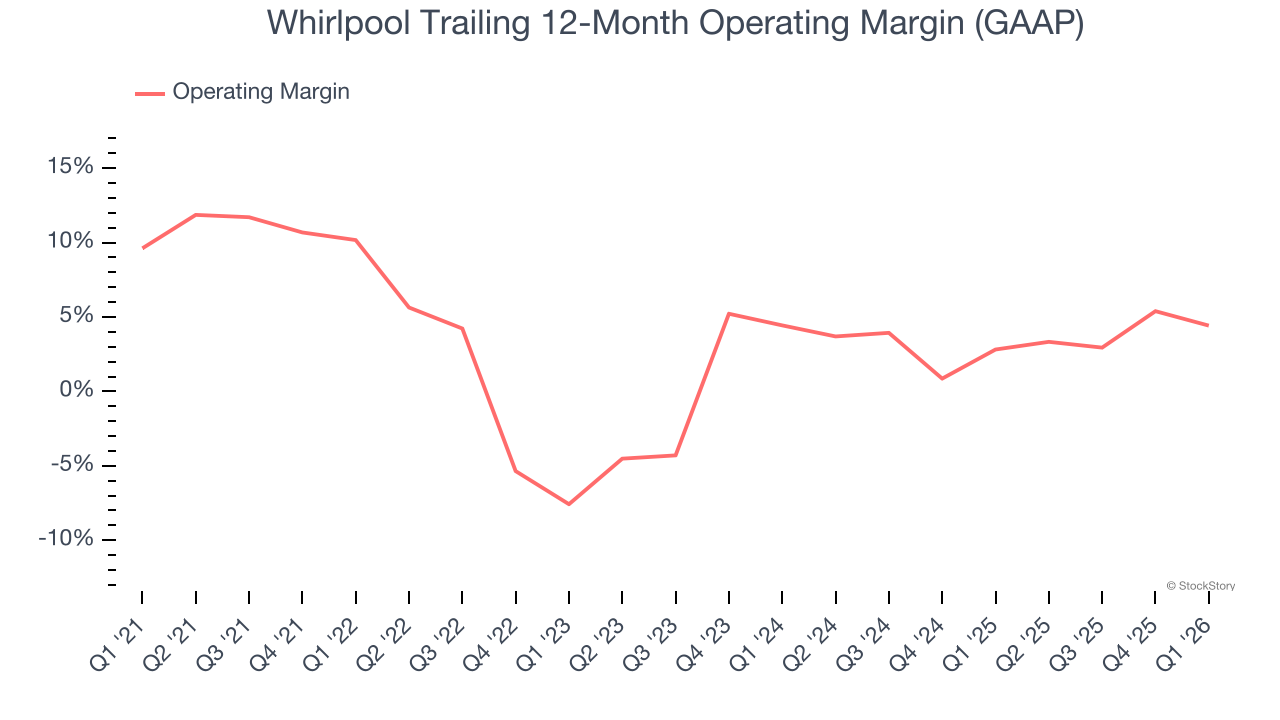
This quarter, Whirlpool’s breakeven margin was 0.5%, down 4.5 percentage points year on year. Since Whirlpool’s operating margin decreased more than its gross margin, we can assume it was less efficient because expenses such as marketing, R&D, and administrative overhead increased.
Earnings Per Share
We track the long-term change in earnings per share (EPS) for the same reason as long-term revenue growth. Compared to revenue, however, EPS highlights whether a company’s growth is profitable.
Sadly for Whirlpool, its EPS declined by 32.7% annually over the last five years, more than its revenue. This tells us the company struggled because its fixed cost base made it difficult to adjust to shrinking demand.
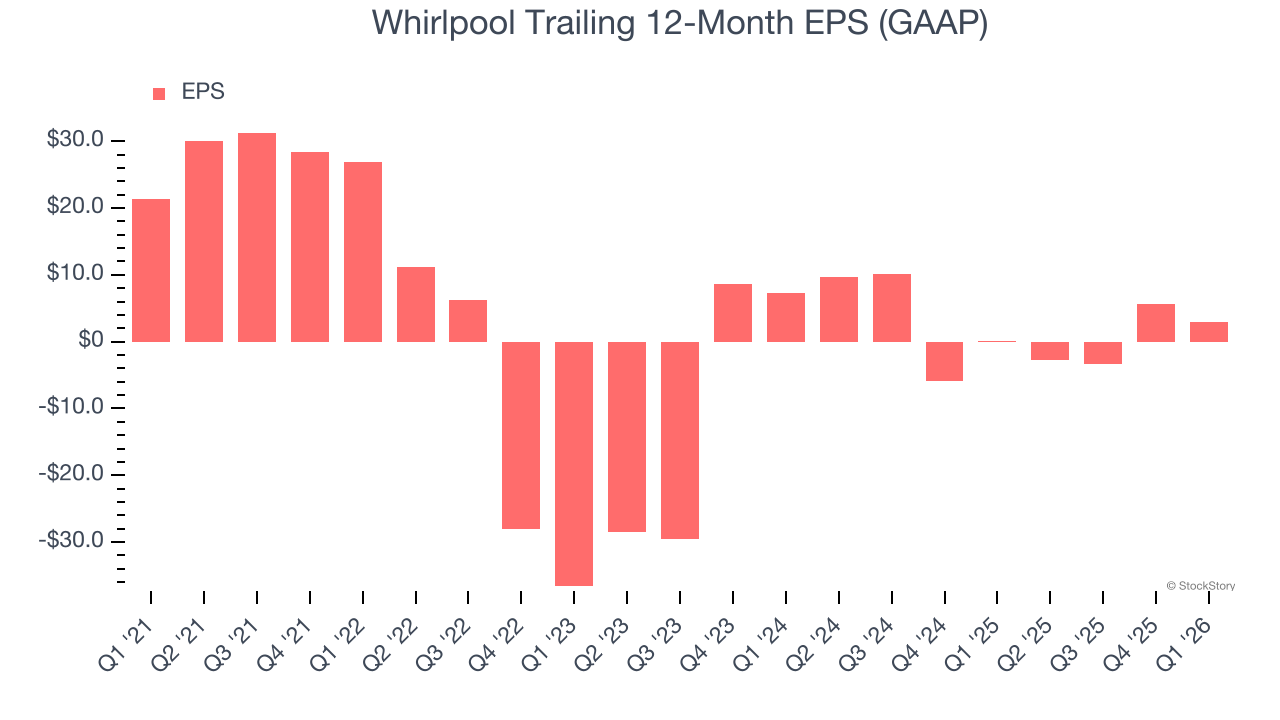
We can take a deeper look into Whirlpool’s earnings to better understand the drivers of its performance. As we mentioned earlier, Whirlpool’s operating margin declined by 5.7 percentage points over the last five years. This was the most relevant factor (aside from the revenue impact) behind its lower earnings; interest expenses and taxes can also affect EPS but don’t tell us as much about a company’s fundamentals.
Like with revenue, we analyze EPS over a shorter period to see if we are missing a change in the business.
For Whirlpool, its two-year annual EPS declines of 36.3% show it’s continued to underperform. These results were bad no matter how you slice the data.
In Q1, Whirlpool reported EPS of negative $1.43, down from $1.27 in the same quarter last year. This print missed analysts’ estimates. Over the next 12 months, Wall Street expects Whirlpool’s full-year EPS of $2.93 to grow 69.3%.
Key Takeaways from Whirlpool’s Q1 Results
We struggled to find many positives in these results. Its revenue missed and its adjusted operating income fell short of Wall Street’s estimates. Overall, this quarter could have been better. The stock traded down 19.5% to $44.05 immediately after reporting.
Whirlpool’s earnings report left more to be desired. Let’s look forward to see if this quarter has created an opportunity to buy the stock. The latest quarter does matter, but not nearly as much as longer-term fundamentals and valuation, when deciding if the stock is a buy. We cover that in our actionable full research report which you can read here (it’s free).