
Magnolia Oil & Gas has followed the market’s trajectory closely, rising in tandem with the S&P 500 over the past six months. The stock has climbed by 11.1% to $24.99 per share while the index has gained 9.3%.
Is now the time to buy MGY? Find out in our full research report, it’s free.
Why Does Magnolia Oil & Gas Spark Debate?
Operating over 600,000 net acres primarily in two distinct South Texas regions, Magnolia Oil & Gas (NYSE: MGY) drills and produces oil, natural gas, and natural gas liquids from South Texas formations.
Two Things to Like:
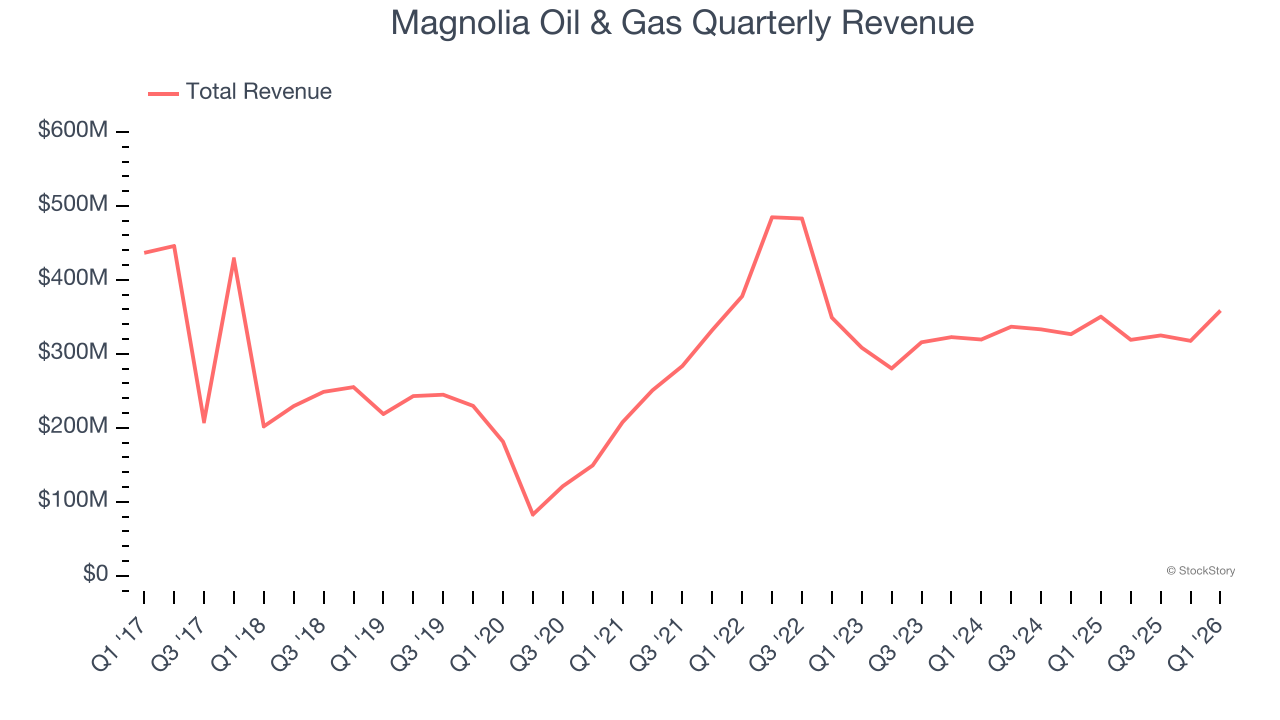
1. Skyrocketing Revenue Shows Strong Momentum
Cyclical sectors like Energy often flatter weaker operators during favorable price environments, but a longer-term lens separates those from businesses that can consistently perform across market cycles. Over the last five years, Magnolia Oil & Gas grew its sales at an impressive 18.7% compounded annual growth rate. Its growth surpassed the average energy upstream and integrated energy company and shows its offerings resonate with customers.
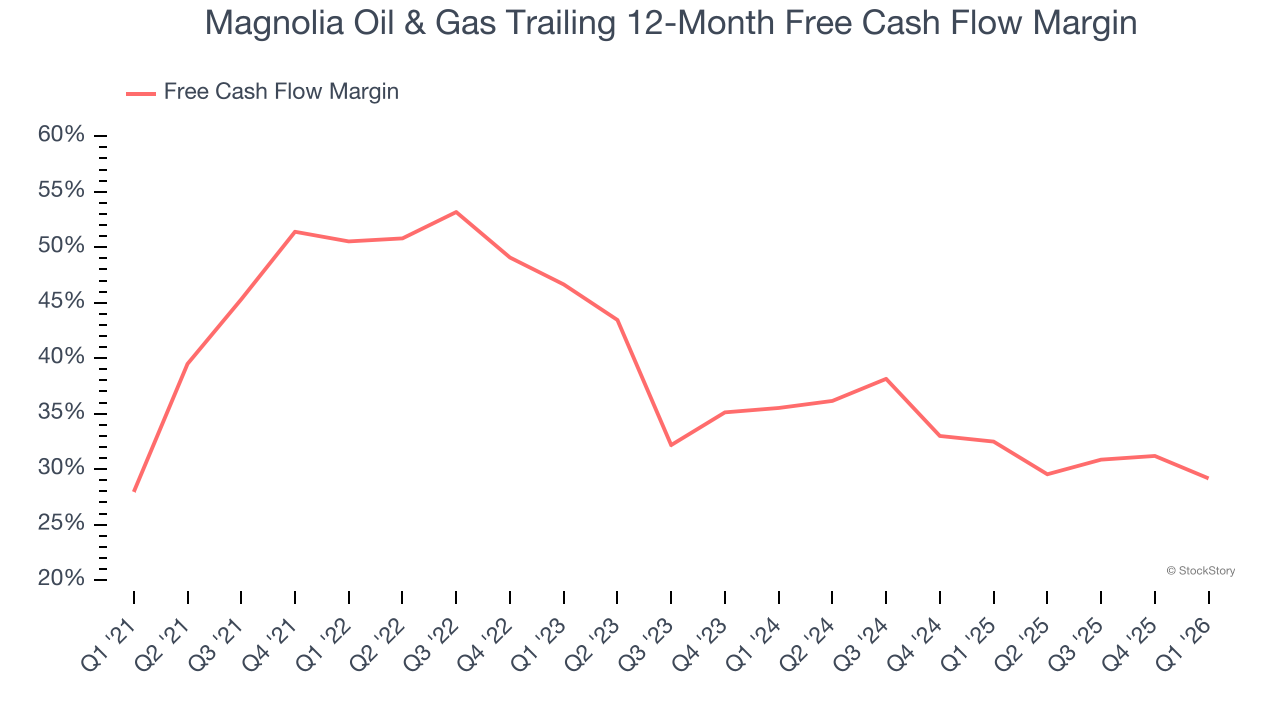
2. Excellent Free Cash Flow Margin Boosts Reinvestment Potential
Free cash flow isn’t a prominently featured metric in company financials and earnings releases, but we think it’s telling because it accounts for all operating and capital expenses, making it tough to manipulate. Cash is king.
Magnolia Oil & Gas has shown terrific cash profitability, driven by its lucrative business model that enables it to reinvest, return capital to investors, and stay ahead of the competition. The company’s free cash flow margin was among the best in the energy upstream and integrated energy sector, averaging an eye-popping 39.1% over the last five years.
One Reason to Be Careful:
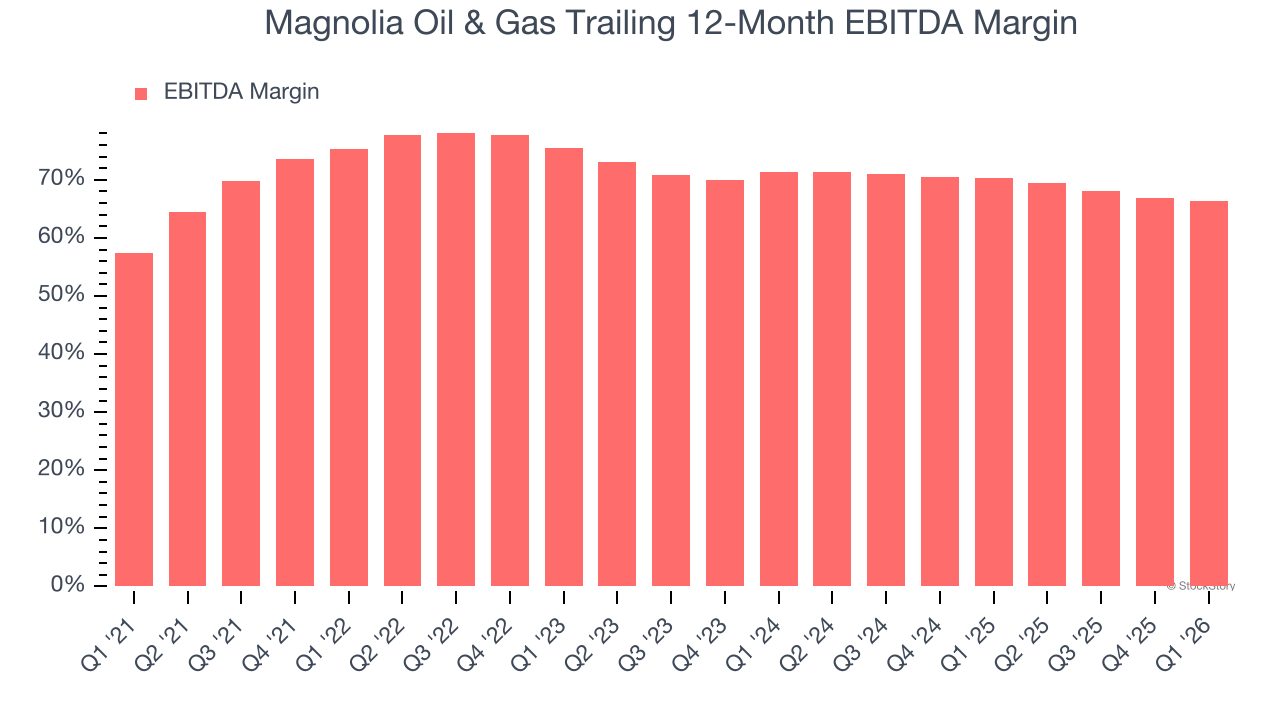
Shrinking EBITDA Margin
Adjusted EBITDA margin is an important measure of profitability for the sector and accounts for the gross margins and operating costs mentioned previously. Unlike operating margin, it is not distorted by accounting conventions around reserves, drilling costs, and assumptions on commodity consumption from the well or basin. Adjusted EBITDA highlights the economic reality of how much cash the rock produces before the capital structure (debt service) and the drilling budget (capex) are considered.
Analyzing the trend in its profitability, Magnolia Oil & Gas’s EBITDA margin decreased by 8.9 percentage points over the last year. Even though its historical margin was healthy, shareholders will want to see Magnolia Oil & Gas become more profitable in the future. Its EBITDA margin for the trailing 12 months was 66.4%.
Final Judgment
Magnolia Oil & Gas has huge potential even though it has some open questions, but at $24.99 per share (or 8.4× forward P/E), is now the right time to buy the stock? See for yourself in our in-depth research report, it’s free.
High-Quality Stocks for All Market Conditions
ALSO WORTH WATCHING: Top 5 Momentum Stocks. The best time to own a great stock is when the market is finally noticing it. These aren’t just high-quality businesses. Something is happening with them right now. Elite fundamentals meet near-term momentum — both boxes checked at the same time.
Find out which stocks our AI platform is flagging this week. See this week’s Strong Momentum stocks — FREE. Get Our Strong Momentum Stocks for Free HERE.
Stocks that have made our list include now familiar names such as Nvidia (+1,326% between June 2020 and June 2025) as well as under-the-radar businesses like the once-small-cap company Comfort Systems (+782% five-year return). Find your next big winner with StockStory today.


