Government services provider Maximus (NYSE: MMS) missed Wall Street’s revenue expectations in Q3 CY2025, with sales flat year on year at $1.32 billion. The company’s full-year revenue guidance of $5.33 billion at the midpoint came in 4.5% below analysts’ estimates. Its non-GAAP profit of $1.62 per share was 3% below analysts’ consensus estimates.
Is now the time to buy Maximus? Find out by accessing our full research report, it’s free for active Edge members.
Maximus (MMS) Q3 CY2025 Highlights:
- Revenue: $1.32 billion vs analyst estimates of $1.34 billion (flat year on year, 1.7% miss)
- Adjusted EPS: $1.62 vs analyst expectations of $1.67 (3% miss)
- Adjusted EBITDA: $160.2 million vs analyst estimates of $166.6 million (12.2% margin, 3.8% miss)
- Adjusted EPS guidance for the upcoming financial year 2026 is $8.10 at the midpoint, beating analyst estimates by 6.2%
- EBITDA guidance for the upcoming financial year 2026 is $729 million at the midpoint, above analyst estimates of $711.8 million
- Operating Margin: 9.3%, in line with the same quarter last year
- Free Cash Flow Margin: 48.7%, up from 10% in the same quarter last year
- Market Capitalization: $4.38 billion
"Fiscal 2025 was a year of significant achievement for Maximus, as our teams skillfully navigated shifting priorities, seized opportunities to step up for our customers, and ultimately delivered revenue growth and profitability well above our expectations at the beginning of the fiscal year," said Bruce Caswell, President and Chief Executive Officer.
Company Overview
With nearly 50 years of experience translating public policy into operational programs that serve millions of citizens, Maximus (NYSE: MMS) provides operational services, clinical assessments, and technology solutions to government agencies in the U.S. and internationally.
Revenue Growth
A company’s long-term performance is an indicator of its overall quality. Any business can put up a good quarter or two, but many enduring ones grow for years.
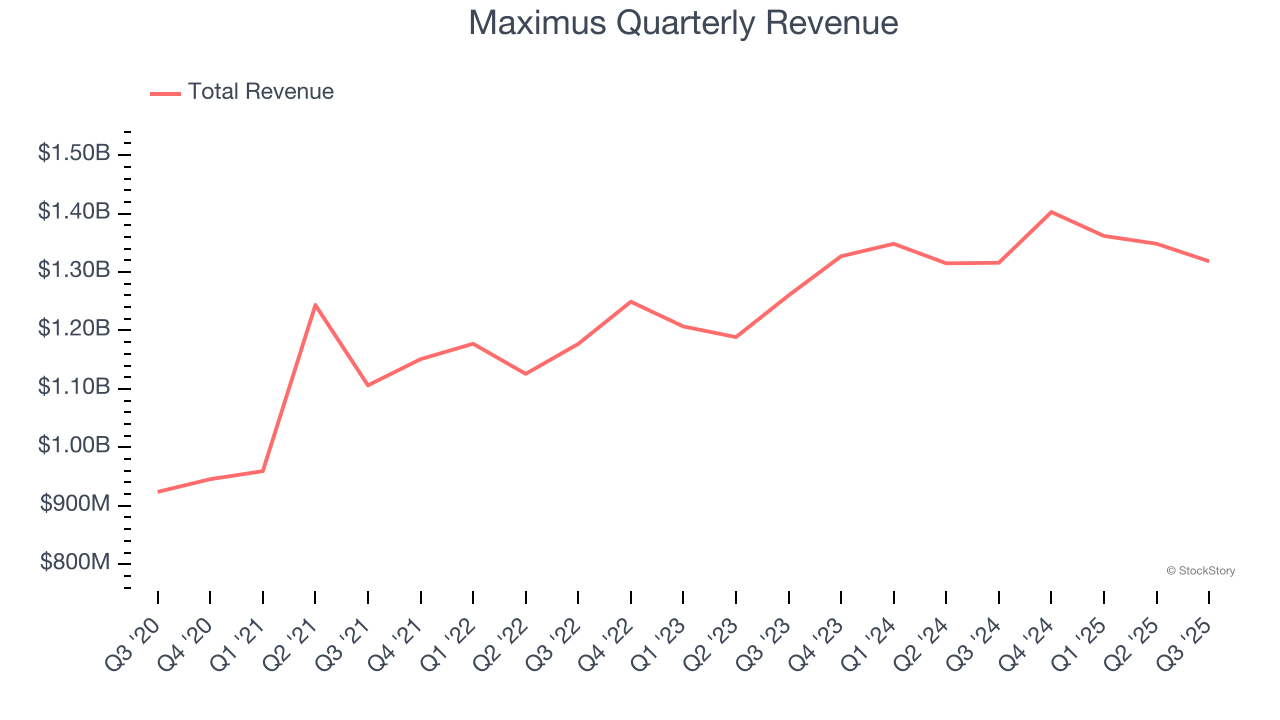
With $5.43 billion in revenue over the past 12 months, Maximus is one of the larger companies in the business services industry and benefits from a well-known brand that influences purchasing decisions.
As you can see below, Maximus’s sales grew at an impressive 9.4% compounded annual growth rate over the last five years. This shows it had high demand, a useful starting point for our analysis.
We at StockStory place the most emphasis on long-term growth, but within business services, a half-decade historical view may miss recent innovations or disruptive industry trends. Maximus’s annualized revenue growth of 5.2% over the last two years is below its five-year trend, but we still think the results were respectable. 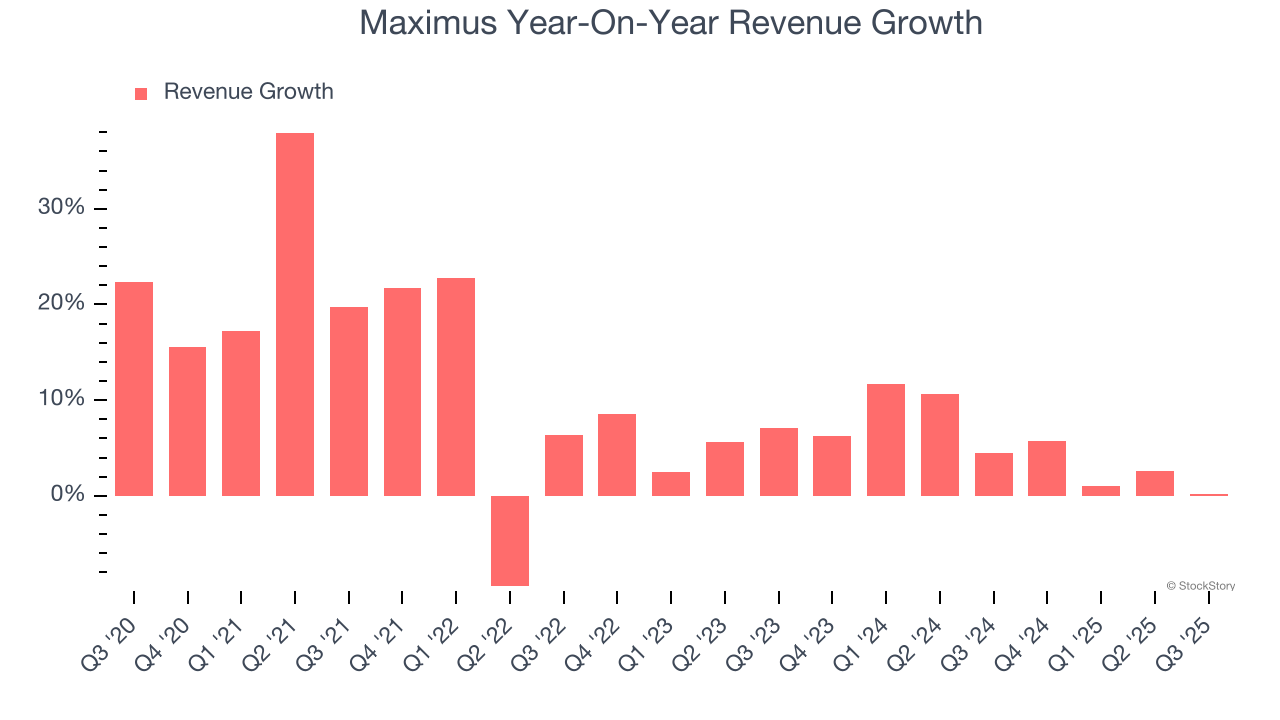
This quarter, Maximus’s $1.32 billion of revenue was flat year on year, falling short of Wall Street’s estimates.
Looking ahead, sell-side analysts expect revenue to grow 4.1% over the next 12 months, similar to its two-year rate. This projection is underwhelming and implies its products and services will see some demand headwinds.
The 1999 book Gorilla Game predicted Microsoft and Apple would dominate tech before it happened. Its thesis? Identify the platform winners early. Today, enterprise software companies embedding generative AI are becoming the new gorillas. a profitable, fast-growing enterprise software stock that is already riding the automation wave and looking to catch the generative AI next.
Operating Margin
Maximus’s operating margin might fluctuated slightly over the last 12 months but has remained more or less the same, averaging 8.5% over the last five years. This profitability was mediocre for a business services business and caused by its suboptimal cost structure.
Looking at the trend in its profitability, Maximus’s operating margin might fluctuated slightly but has generally stayed the same over the last five years. This raises questions about the company’s expense base because its revenue growth should have given it leverage on its fixed costs, resulting in better economies of scale and profitability.
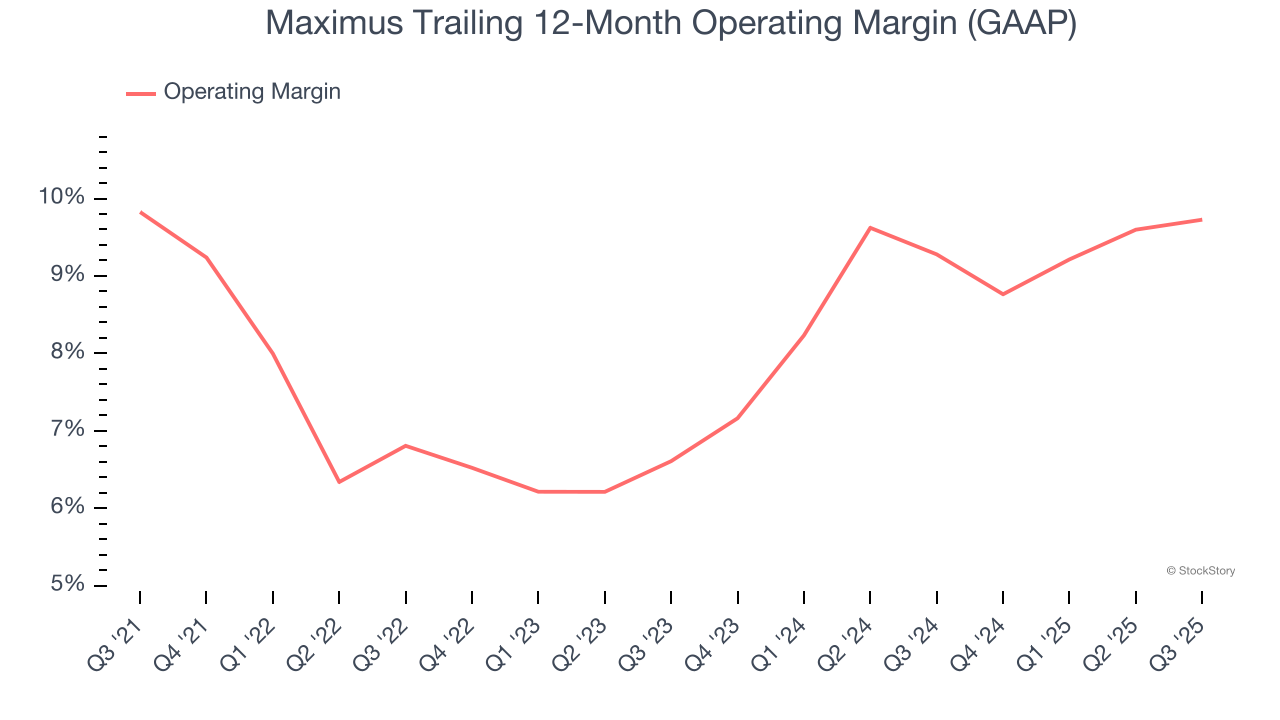
In Q3, Maximus generated an operating margin profit margin of 9.3%, in line with the same quarter last year. This indicates the company’s overall cost structure has been relatively stable.
Earnings Per Share
We track the long-term change in earnings per share (EPS) for the same reason as long-term revenue growth. Compared to revenue, however, EPS highlights whether a company’s growth is profitable.
Maximus’s EPS grew at an astounding 16.8% compounded annual growth rate over the last five years, higher than its 9.4% annualized revenue growth. However, this alone doesn’t tell us much about its business quality because its operating margin didn’t improve.
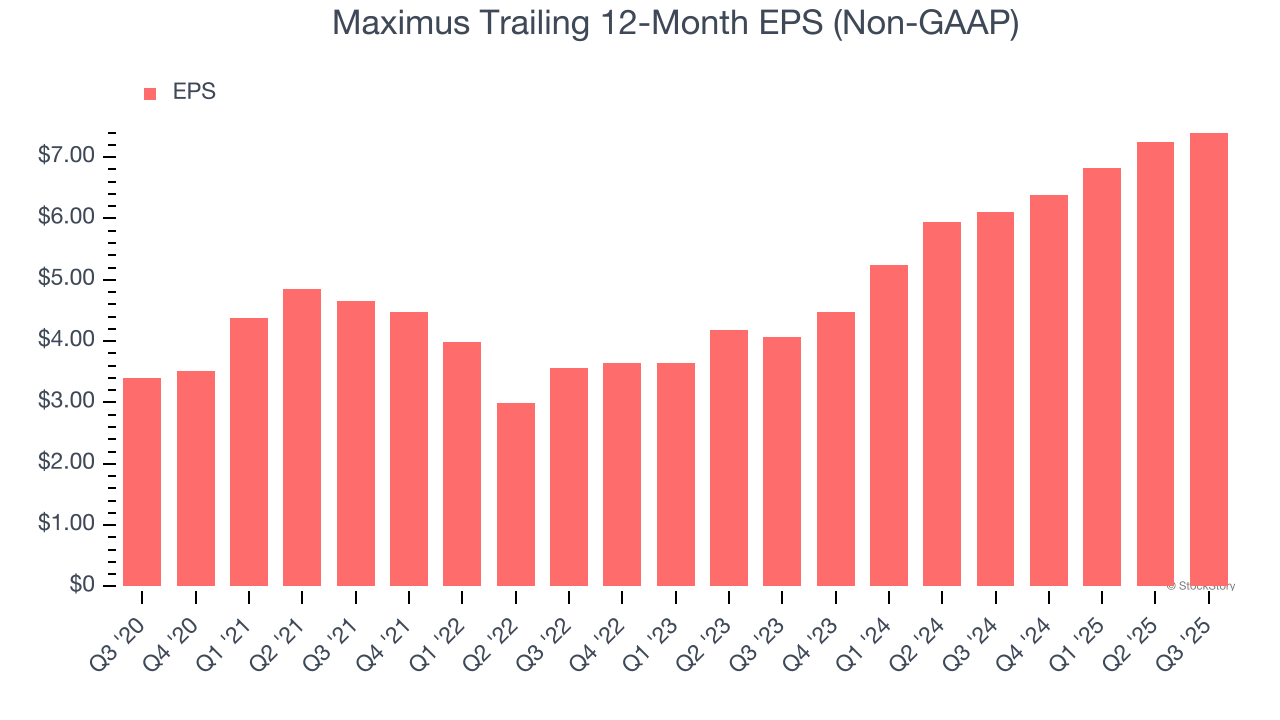
Like with revenue, we analyze EPS over a more recent period because it can provide insight into an emerging theme or development for the business.
For Maximus, its two-year annual EPS growth of 34.8% was higher than its five-year trend. We love it when earnings growth accelerates, especially when it accelerates off an already high base.
In Q3, Maximus reported adjusted EPS of $1.62, up from $1.46 in the same quarter last year. Despite growing year on year, this print missed analysts’ estimates, but we care more about long-term adjusted EPS growth than short-term movements. Over the next 12 months, Wall Street expects Maximus’s full-year EPS of $7.40 to grow 3.1%.
Key Takeaways from Maximus’s Q3 Results
We were impressed by how significantly Maximus blew past analysts’ full-year EPS guidance expectations this quarter. On the other hand, its full-year revenue guidance missed and its revenue fell short of Wall Street’s estimates. Overall, this was a weaker quarter. The stock remained flat at $77.76 immediately following the results.
Big picture, is Maximus a buy here and now? What happened in the latest quarter matters, but not as much as longer-term business quality and valuation, when deciding whether to invest in this stock. We cover that in our actionable full research report which you can read here, it’s free for active Edge members.


