
Hotel franchising company Wyndham (NYSE: WH) missed Wall Street’s revenue expectations in Q4 CY2025, with sales falling 2.1% year on year to $334 million. Its non-GAAP profit of $0.93 per share was 4.4% above analysts’ consensus estimates.
Is now the time to buy Wyndham? Find out by accessing our full research report, it’s free.
Wyndham (WH) Q4 CY2025 Highlights:
- Revenue: $334 million vs analyst estimates of $336 million (2.1% year-on-year decline, 0.6% miss)
- Adjusted EPS: $0.93 vs analyst estimates of $0.89 (4.4% beat)
- Adjusted EBITDA: $165 million vs analyst estimates of $162.4 million (49.4% margin, 1.6% beat)
- Adjusted EPS guidance for the upcoming financial year 2026 is $4.71 at the midpoint, missing analyst estimates by 5.2%
- EBITDA guidance for the upcoming financial year 2026 is $737.5 million at the midpoint, below analyst estimates of $759.1 million
- Operating Margin: -10.8%, down from 38.1% in the same quarter last year
- Free Cash Flow Margin: 50.3%, up from 32% in the same quarter last year
- RevPAR: $42.91 at quarter end, up 7.2% year on year
- Market Capitalization: $6.07 billion
"Our teams around the world opened a record 72,000 rooms, delivered 4% global net room growth and grew our global development pipeline to a record 259,000 rooms," said Geoff Ballotti, president and chief executive officer.
Company Overview
Established in 1981, Wyndham (NYSE: WH) is a global hotel franchising company with over 9,000 hotels across nearly 95 countries on six continents.
Revenue Growth
A company’s long-term performance is an indicator of its overall quality. Any business can put up a good quarter or two, but the best consistently grow over the long haul. Regrettably, Wyndham’s sales grew at a weak 1.9% compounded annual growth rate over the last five years. This fell short of our benchmarks and is a rough starting point for our analysis.
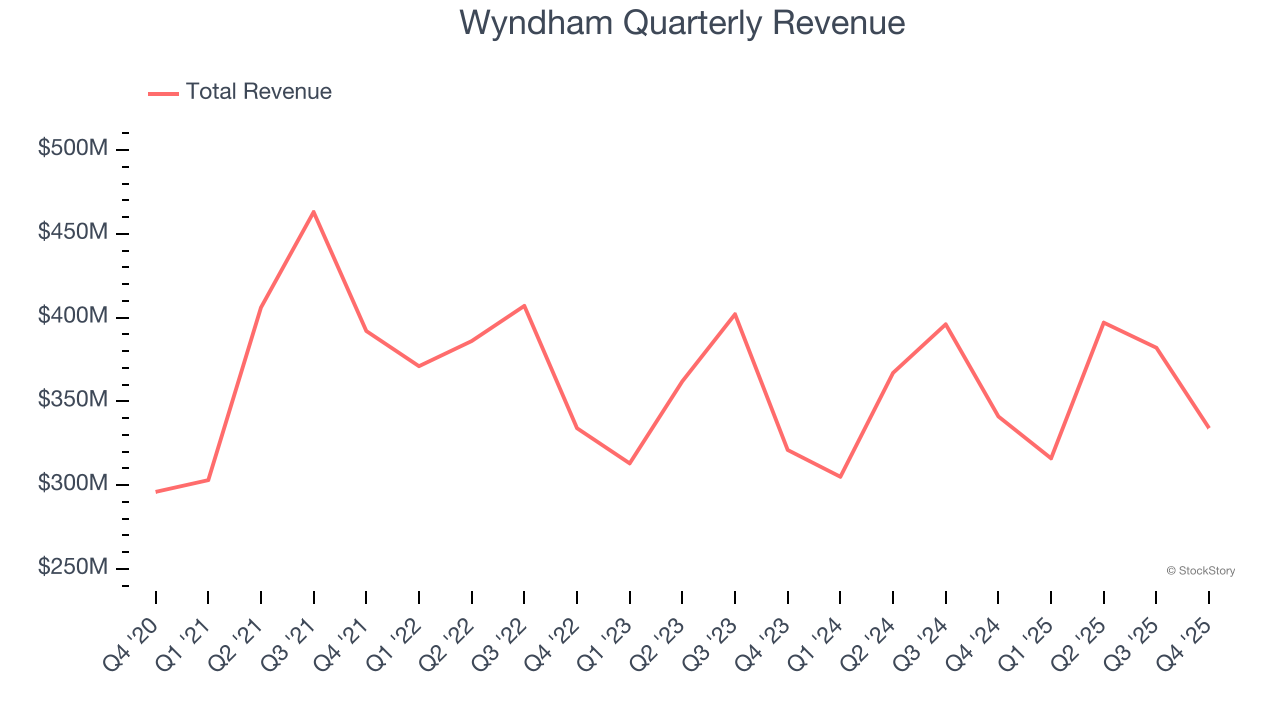
We at StockStory place the most emphasis on long-term growth, but within consumer discretionary, a stretched historical view may miss a company riding a successful new property or trend. Wyndham’s annualized revenue growth of 1.1% over the last two years aligns with its five-year trend, suggesting its demand was consistently weak. 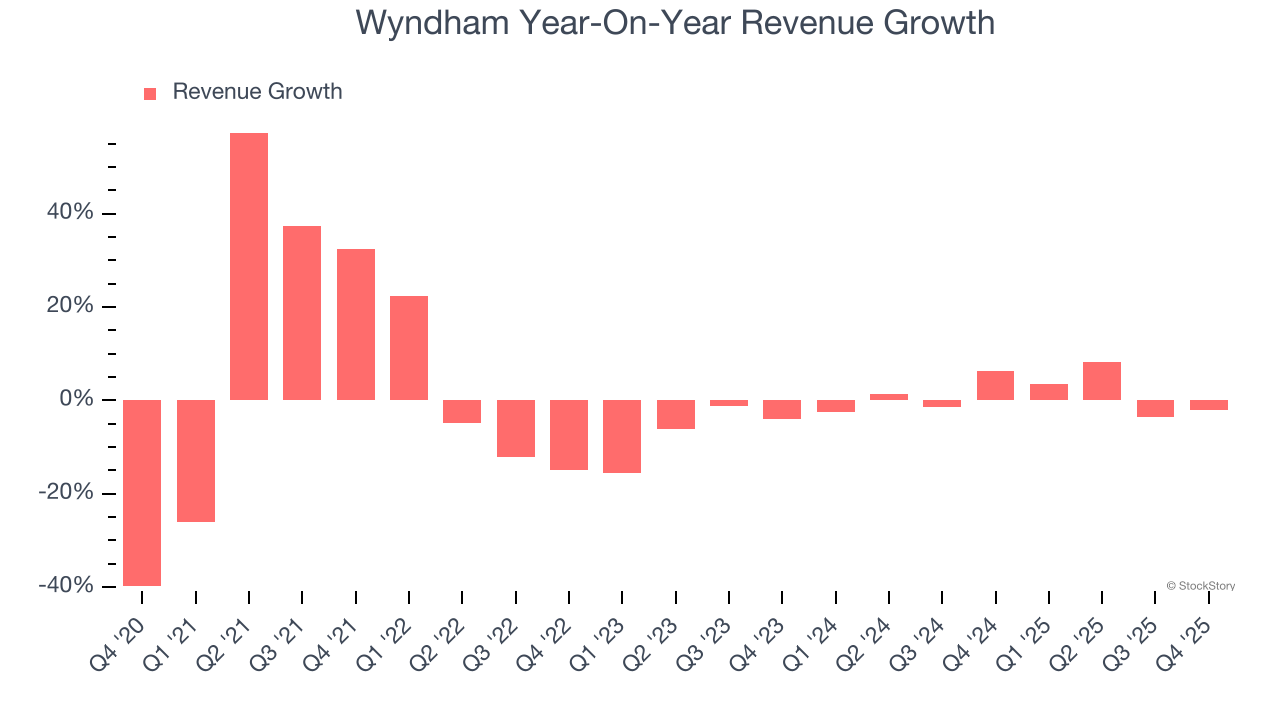
Wyndham also reports revenue per available room, which clocked in at $42.91 this quarter and is a key metric accounting for daily rates and occupancy levels. Over the last two years, Wyndham’s revenue per room averaged 2.3% year-on-year growth, which is quite underwhelming. This number doesn’t surprise us as it’s in line with its revenue growth. It is sometimes the strategy of hotels to grow ancillary revenues because they are price takers in room revenues. 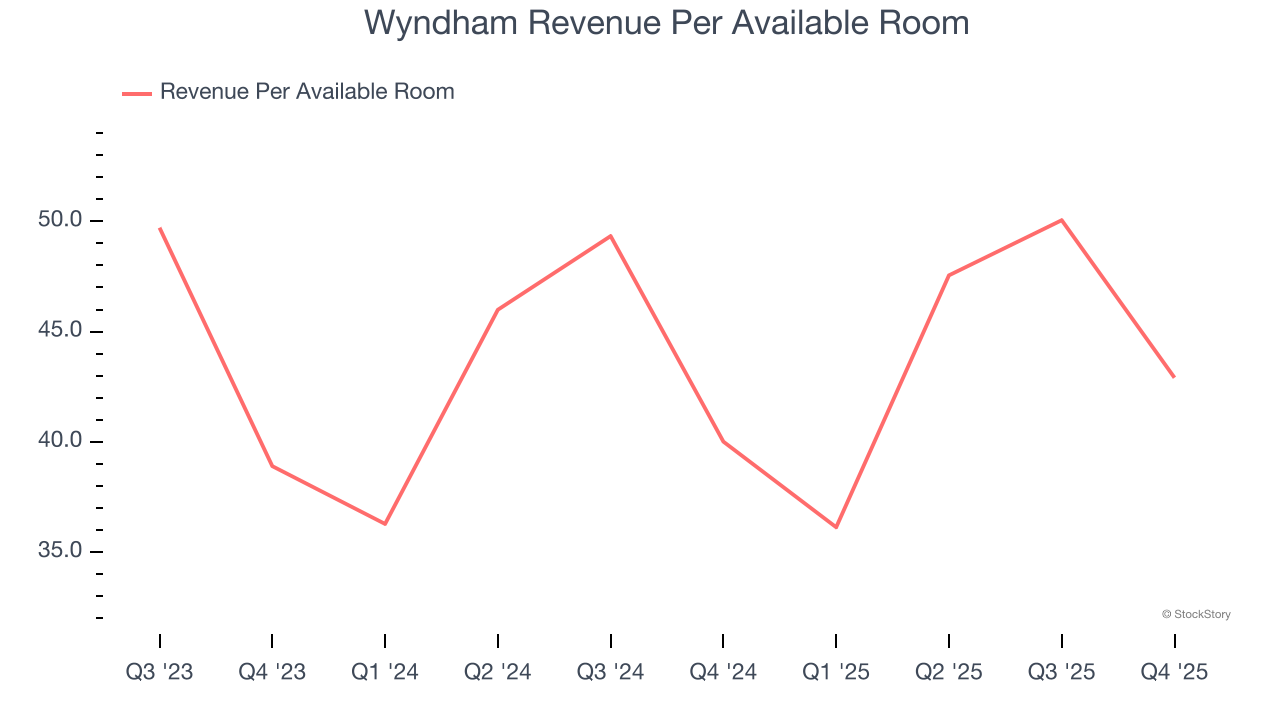
This quarter, Wyndham missed Wall Street’s estimates and reported a rather uninspiring 2.1% year-on-year revenue decline, generating $334 million of revenue.
Looking ahead, sell-side analysts expect revenue to grow 5.5% over the next 12 months. Although this projection implies its newer products and services will catalyze better top-line performance, it is still below average for the sector.
While Wall Street chases Nvidia at all-time highs, an under-the-radar semiconductor supplier is dominating a critical AI component these giants can’t build without. Click here to access our free report one of our favorites growth stories.
Operating Margin
Operating margin is an important measure of profitability as it shows the portion of revenue left after accounting for all core expenses – everything from the cost of goods sold to advertising and wages. It’s also useful for comparing profitability across companies with different levels of debt and tax rates because it excludes interest and taxes.
Wyndham’s operating margin has shrunk over the last 12 months and averaged 31.7% over the last two years. The company’s profitability was mediocre for a consumer discretionary business and shows it couldn’t pass its higher operating expenses onto its customers.
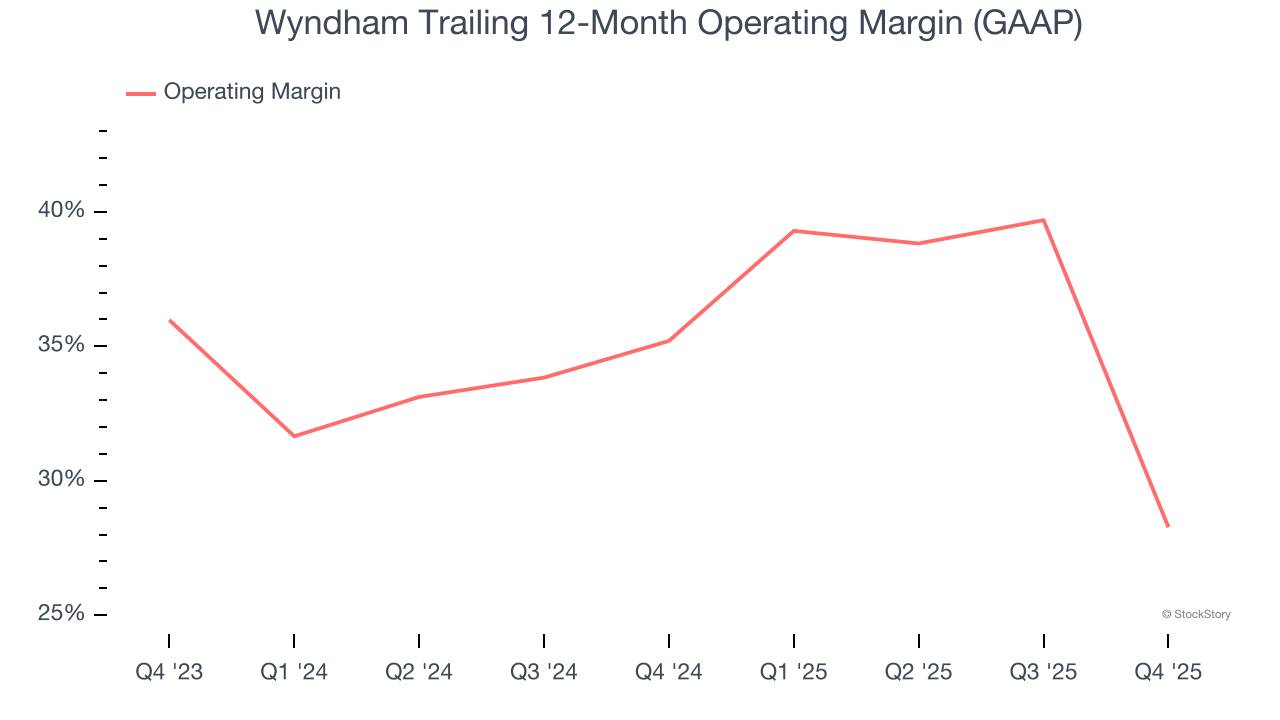
In Q4, Wyndham generated an operating margin profit margin of negative 10.8%, down 48.9 percentage points year on year. This contraction shows it was less efficient because its expenses increased relative to its revenue.
Earnings Per Share
We track the long-term change in earnings per share (EPS) for the same reason as long-term revenue growth. Compared to revenue, however, EPS highlights whether a company’s growth is profitable.
Wyndham’s EPS grew at a decent 34.8% compounded annual growth rate over the last five years, higher than its 1.9% annualized revenue growth. However, this alone doesn’t tell us much about its business quality because its operating margin didn’t improve.
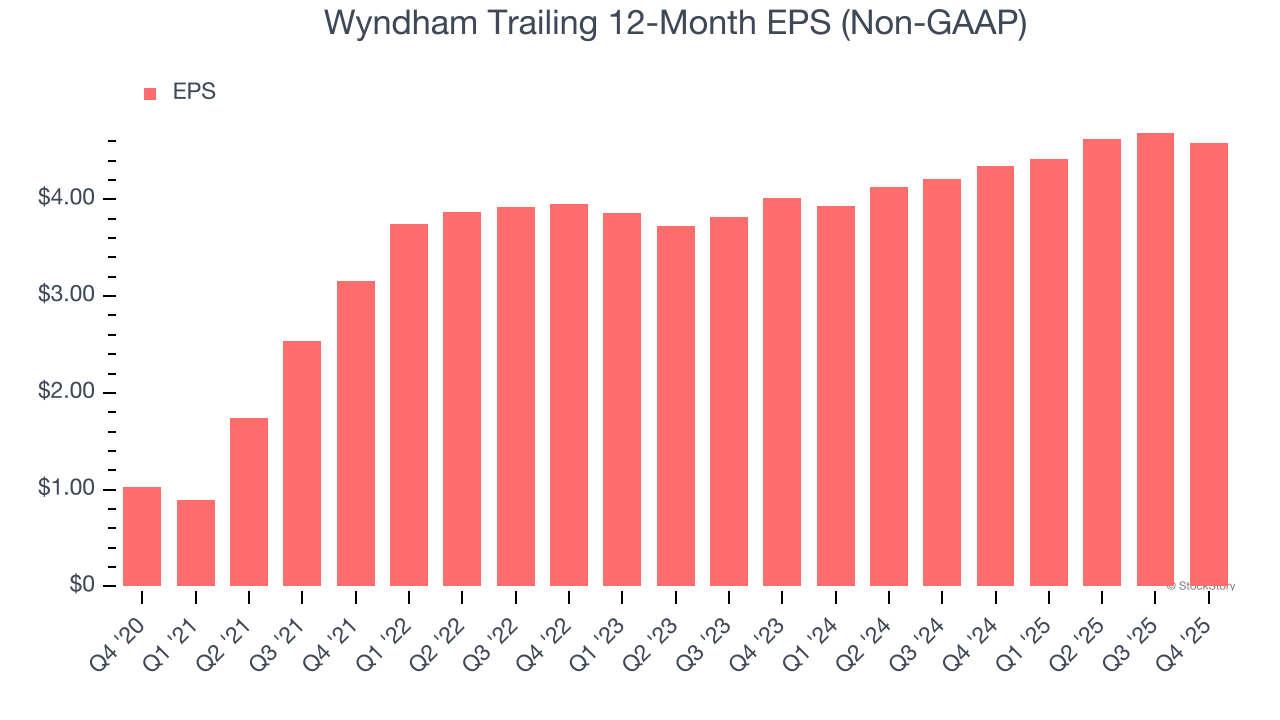
In Q4, Wyndham reported adjusted EPS of $0.93, down from $1.04 in the same quarter last year. Despite falling year on year, this print beat analysts’ estimates by 4.4%. Over the next 12 months, Wall Street expects Wyndham’s full-year EPS of $4.58 to grow 7.4%.
Key Takeaways from Wyndham’s Q4 Results
It was good to see Wyndham beat analysts’ EPS expectations this quarter. On the other hand, its full-year EBITDA guidance missed and its revenue fell slightly short of Wall Street’s estimates. Overall, this was a softer quarter. The stock traded down 1.2% to $79.25 immediately after reporting.
Big picture, is Wyndham a buy here and now? What happened in the latest quarter matters, but not as much as longer-term business quality and valuation, when deciding whether to invest in this stock. We cover that in our actionable full research report which you can read here (it’s free).


