Natural gas producer EQT (NYSE: EQT) reported revenue ahead of Wall Street’s expectations in Q2 CY2026, with sales up 13.2% year on year to $1.81 billion. Its non-GAAP profit of $0.39 per share was 3.2% below analysts’ consensus estimates.
Is now the time to buy EQT? Find out by accessing our full research report, it’s free.
EQT (EQT) Q2 CY2026 Highlights:
- Revenue: $1.81 billion vs analyst estimates of $1.74 billion (13.2% year-on-year growth, 4% beat)
- Adjusted EPS: $0.39 vs analyst expectations of $0.40 (3.2% miss)
- Adjusted EBITDA: $1.2 billion vs analyst estimates of $1.08 billion (66.5% margin, 11.1% beat)
- Operating Margin: 21.8%, down from 44.3% in the same quarter last year (lower gains on derivatives vs. last year)
- Free Cash Flow Margin: 22%, down from 43.3% in the same quarter last year
- Oil production: up 49.3% year on year
- Market Capitalization: $30.68 billion
Company Overview
The largest natural gas producer in the United States by daily volume, EQT (NYSE: EQT) produces natural gas and natural gas liquids from wells drilled in the Appalachian Basin.
Revenue Growth
A company’s long-term performance can give signals about its business quality. Even a bad business, especially in a cyclical industry, can shine for a year or so, but a top-tier one should exhibit resilience through cycles. Luckily, EQT’s sales grew at an impressive 17.8% compounded annual growth rate over the last five years. Its growth surpassed the average energy upstream and integrated energy company and shows its offerings resonate with customers, a great starting point for our analysis.
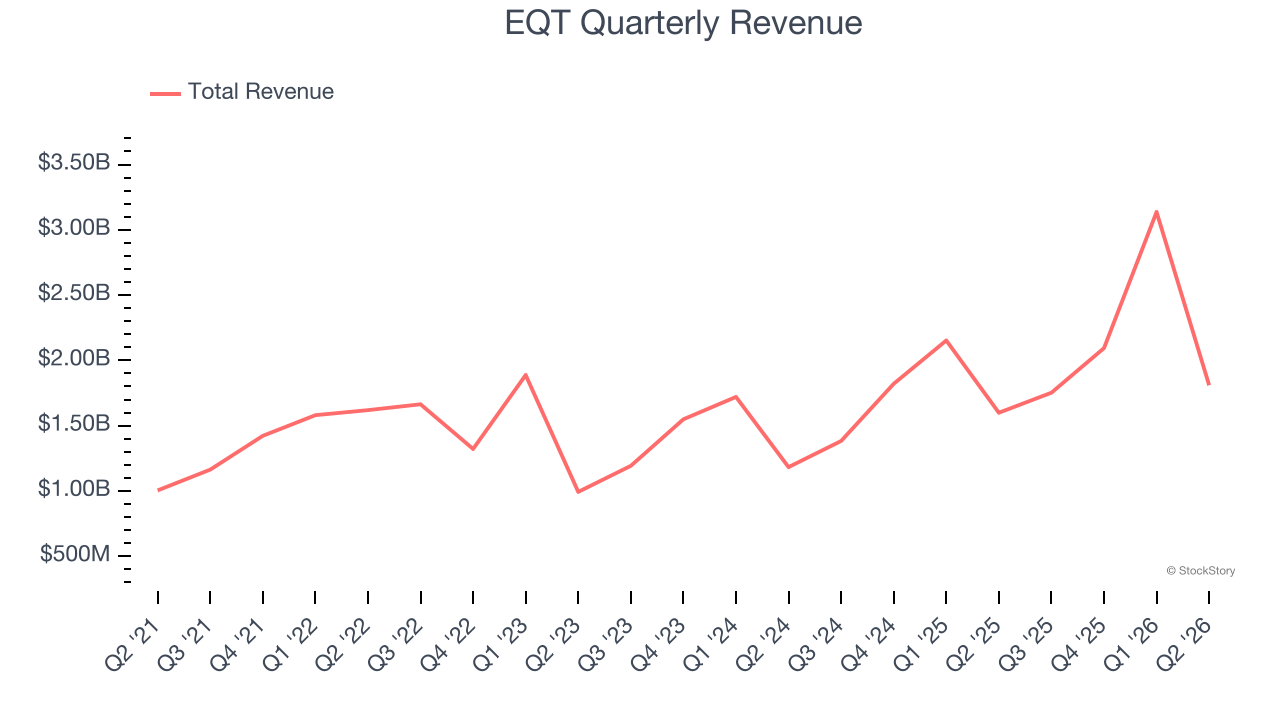
Within Energy, a singular timeframe, even if it’s quite long-term, only sheds light on how well a company rode the last commodity cycle. To better assess whether a company compounds through cycles, we validate our view with an even longer, ten-year view. EQT’s annualized revenue growth of 15.4% over the last ten years is below its five-year trend, but we still think the results suggest decent demand.
Revenue provides useful context, but it is heavily influenced by commodity prices and acquisitions. Production volumes, by contrast, reveal whether the underlying asset base is actually growing. Over the last two years, EQT’s oil production averaged 13% year-on-year growth while its natural gas production averaged 8.5% year-on-year growth. 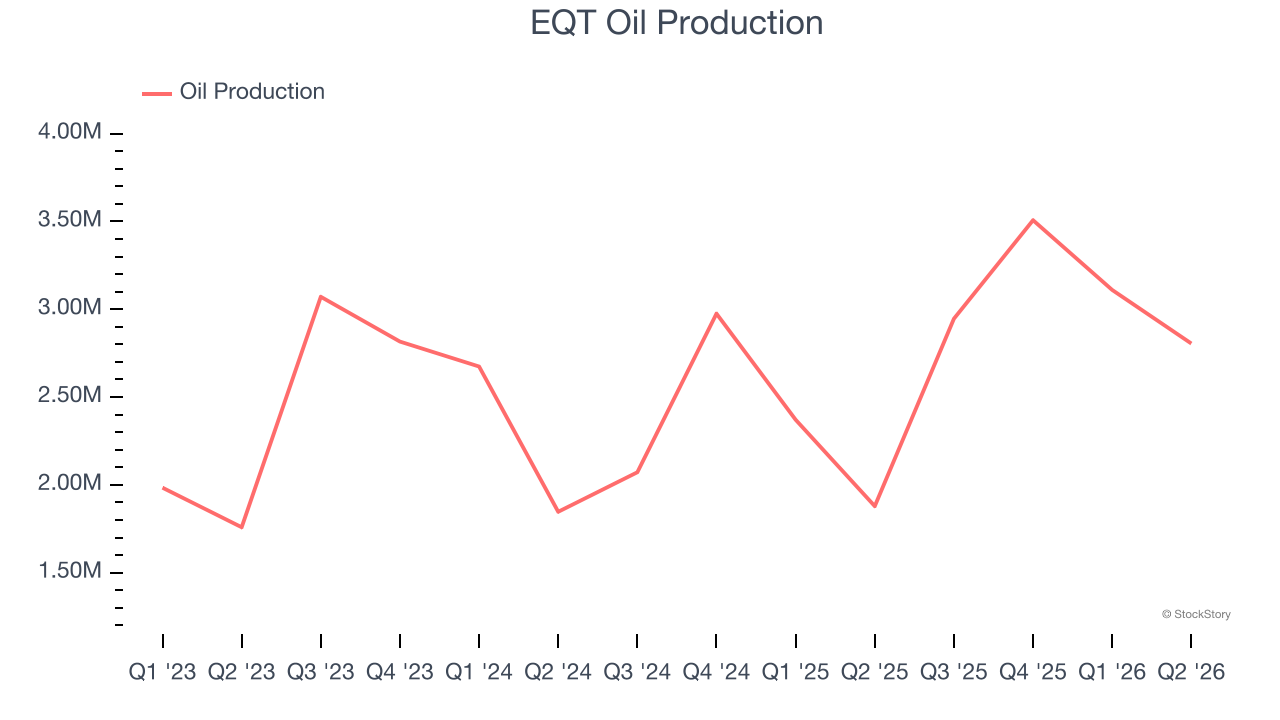
This quarter, EQT reported year-on-year revenue growth of 13.2%, and its $1.81 billion of revenue exceeded Wall Street’s estimates by 4%. This quarter, EQT reported magnificent year-on-year Oil production growth of 49.3%.
ONE MORE THING: 3 Hidden Platforms Growing 3X Faster than Amazon, Google, and PayPal. Amazon, Google, and Meta all followed the same playbook: Dominate an ignored market. Build an unbeatable moat. Scale until you’re unstoppable.
These three platforms are running that exact playbook right now. The early investors in Amazon made fortunes. The early investors in these could do the same. Get All 3 Stocks Here for FREE.
Adjusted EBITDA Margin
Adjusted EBITDA margin strips out accounting distortions tied to depletion and historical drilling spend, providing a clearer view of the cash-generating power of the underlying asset base before financing and reinvestment decisions.
EQT has been a well-oiled machine over the last five years. It demonstrated elite profitability for an upstream and integrated energy business, boasting an average EBITDA margin of 64.6%.
Analyzing the trend in its profitability, EQT’s EBITDA margin rose by 22.5 percentage points over the last year, as its sales growth gave it immense operating leverage.
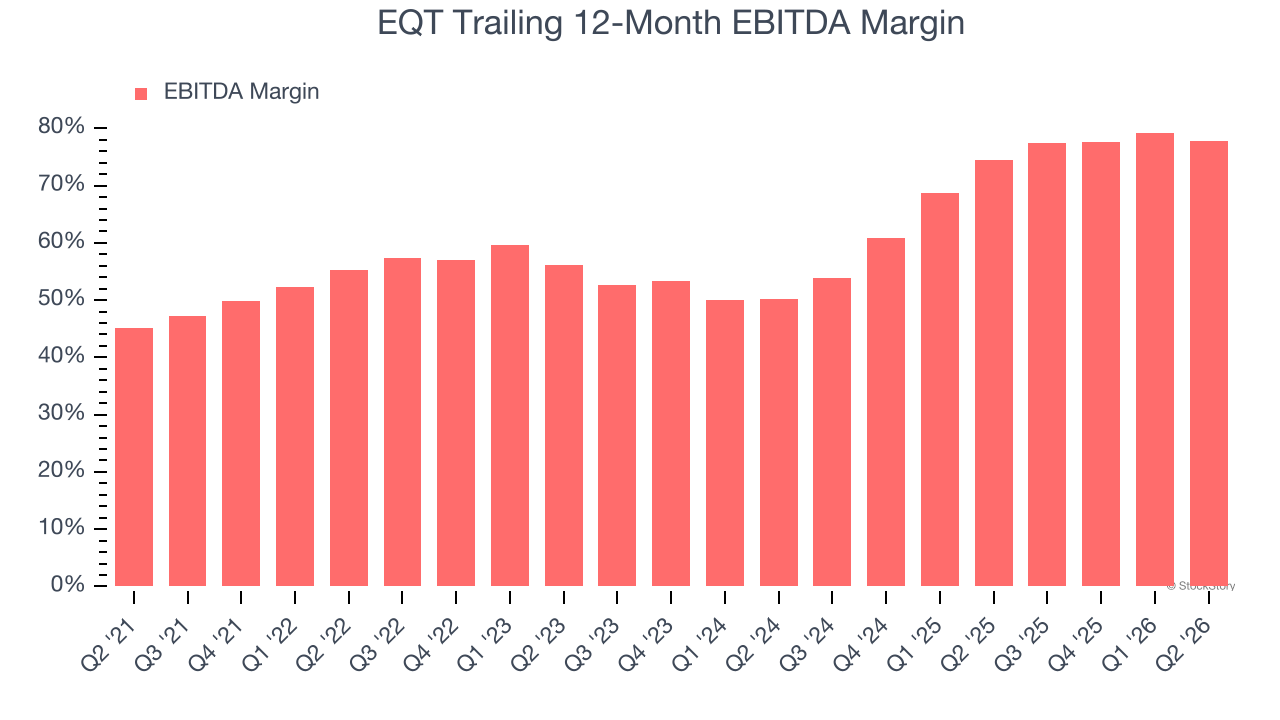
In Q2, EQT generated an EBITDA margin profit margin of 66.5%, down 5.9 percentage points year on year. This contraction shows it was less efficient because its expenses grew faster than its revenue. This adjusted EBITDA beat Wall Street’s estimates by 11.1%.
Cash Is King
Adjusted EBITDA shows how profitable a company’s existing “rock” is before financing and reinvestment, while free cash flow shows how much value remains after paying to replace those wells. Because production declines over time, strong EBITDA can coexist with weak FCF if drilling is expensive or declines are steep. FCF therefore captures both operating efficiency and the cost of sustaining production.
EQT has shown terrific cash profitability, driven by its lucrative business model that enables it to reinvest, return capital to investors, and stay ahead of the competition. The company’s free cash flow margin was among the best in the energy upstream and integrated energy sector, averaging an eye-popping 30.6% over the last five years.
While the level of free cash flow margins is important, their consistency matters just as much.
EQT’s ratio of quarterly free cash flow volatility to Henry Hub gas-price volatility over the past five years was 2.9 (lower is better), indicating unusually strong insulation from commodity swings. This stability supports superior capital access in downturns and positions EQT to act as a consolidator when weaker peers are forced to retrench.
You may be asking why we wait until the free cash flow line to perform this stability analysis versus commodity prices. Why not compare revenue or EBITDA to Henry Hub Natural Gas prices in the case of EQT? Because what ultimately matters is not how much revenue or profit you earn when prices are high but how much cash you can generate when prices are low. Free cash flow is the superior metric because it includes everything from hedging prowess to growth and maintenance capex to management behavior during good times and bad.
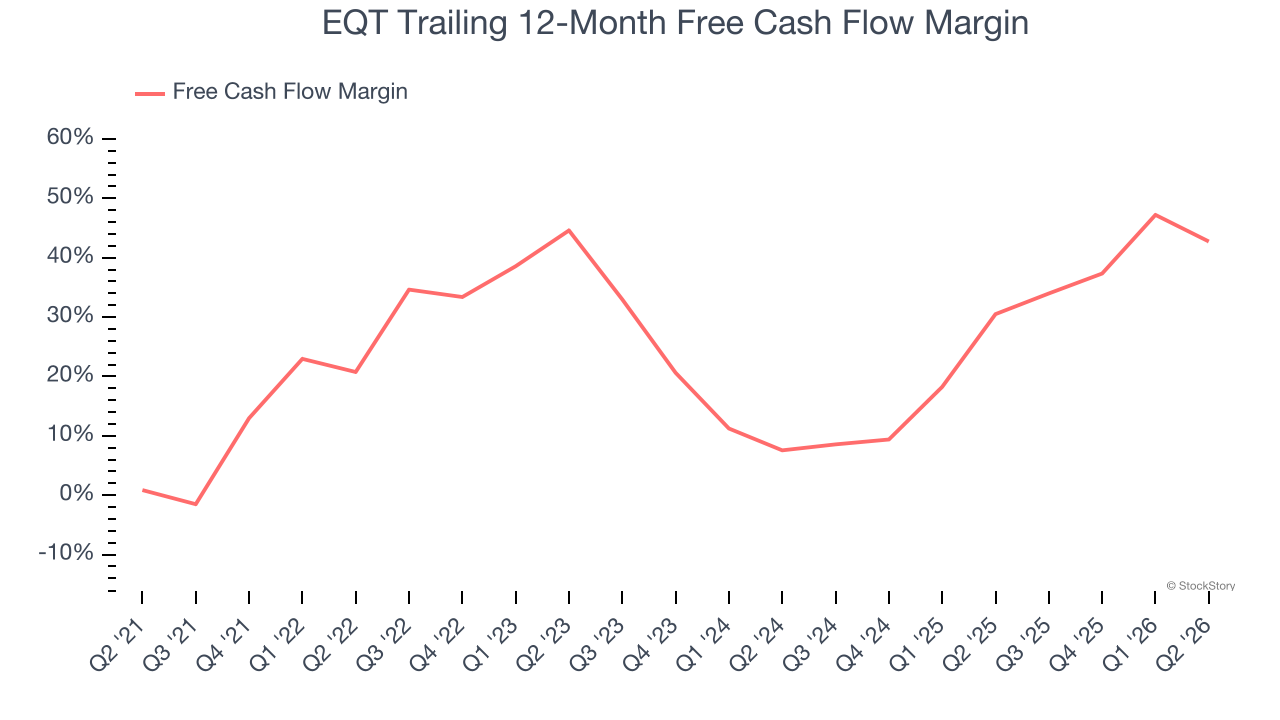
EQT’s free cash flow clocked in at $397.8 million in Q2, equivalent to a 22% margin. The company’s cash profitability regressed as it was 21.3 percentage points lower than in the same quarter last year, but we wouldn’t read too much into the short term because investment needs can be seasonal, leading to temporary swings. Long-term trends are more important.
Key Takeaways from EQT’s Q2 Results
We liked that EQT beat analysts’ revenue expectations this quarter. We were also glad its EBITDA outperformed Wall Street’s estimates. On the other hand, its EPS missed. Zooming out, we think this was a good print with some key areas of upside. The stock remained flat at $50.28 immediately after reporting.
Sure, EQT had a solid quarter, but if we look at the bigger picture, is this stock a buy? The latest quarter does matter, but not nearly as much as longer-term fundamentals and valuation, when deciding if the stock is a buy. We cover that in our actionable full research report which you can read here (it’s free).