All of the amounts disclosed in this press release are in U.S. dollars unless otherwise noted
TEL AVIV, Israel, May 08, 2024 (GLOBE NEWSWIRE) -- Enlight Renewable Energy Ltd. (NASDAQ: ENLT, TASE: ENLT) today reported financial results for the first quarter March 31, 2024. The Company’s earnings webcast will be held today at 8:00 AM ET. A link to this webcast can be found at the end of this earnings release.
| The entire suite of the Company’s 1Q24 financial results can be found on our IR website at https://enlightenergy.co.il/data/financial-reports/ |
Financial Highlights
3 months ending March 31, 2024
- Revenue of $90m, up 27% year over year
- Adjusted EBITDA1 of $68m, up 28% year over year
- Net income of $24m, down 26% year over year
- Cash flow from operations of $35m, down 36% year over year
- Reaffirming full year 2024 guidance
First Quarter Business Developments
- High generation volumes at our wind projects more than offset the impact from low merchant prices in Spain.
- Our U.S. projects are on schedule. Atrisco Solar and Storage are on track for COD in 2H24. Country Acres, Roadrunner and Quail Ranch, totaling 810 MW and 2.0 GWh are fast approaching Ready to Build.
- Achieved financial close for European projects Pupin, Tapolca, and AC/DC, totaling 180 MW. Transactions included $137m of long-term debt and $29m of capital recycled back to Enlight.
- Arad Valley 3, a part of the Israel Solar + Storage cluster, reached COD. Roll out of the remaining 5 sites of the cluster is on track for the rest of this year.
- Project returns continue to rise, boosted by high PPA pricing and record low equipment costs.
- No material changes to the Mature Project portfolio since last quarter’s earnings report.
“Our results this quarter reflect a very robust start to 2024. Revenue grew by 27% and Adjusted EBITDA grew by 28%, driven by the strong performance of our operational assets. On the back of these strong results, we are pleased to reaffirm our full year Financial Outlook for 2024,” said Gilad Yavetz, CEO of Enlight Renewable Energy.
“Operational performance this quarter was superb. Significantly higher energy generation at our wind projects boosted financial results, and construction plans for 2024 are on schedule. Atrisco will be entirely online by the end of 2024, with the construction of three new flagship projects in the United States set to begin during the second half of the year.”
“Industry trends remain supportive for us, especially in the U.S. Estimates for long term load growth in the U.S. are rising significantly, due to increasing demand for power from onshoring of industry, new data centers, and further penetration of EVs. This is pushing PPA pricing higher, even as equipment costs remain low. As a result, returns continue to rise on the portfolio of projects we are set to construct during the coming years.”
Overview of Financial and Operating Results: Revenue
| ($ thousands) | For the three-month period ended | |
| Segment | March 31, 2024 | March 31, 2023 |
| Israel | 28,474 | 13,838 |
| Central-Eastern Europe | 27,999 | 23,235 |
| Western Europe | 31,161 | 31,788 |
| USA | 1,231 | - |
| Management and Construction | 1,532 | 2,133 |
| Total Revenues | 90,397 | 70,994 |
In the first quarter of 2024, the Company’s revenues increased to $90m, up from $71m last year, a growth rate of 27% year over year. The Company benefited from the revenue contribution of new operational projects, as well as higher production and inflation indexation embedded in our PPAs for already operational projects. This was offset by a decline in revenues driven by lower electricity prices in Spain relative to the prices observed in the same quarter in 2023.
Since the first quarter of 2023, 517 MW and 340 MWh of projects began selling electricity, including Apex Solar in the U.S.; ACDC in Hungary; Genesis Wind in Israel; and seven of the Solar & Storage cluster units in Israel. The Company also benefited from the ramp up of project Björnberget in Sweden which was partially operational in the first quarter of last year. These projects collectively generated $21m of revenue during the first quarter of 2024, with the biggest contributors being Björnberget $7m and Genesis Wind $9m. There was no material net FX impact on the Company’s revenues this quarter.
Growth in revenues was offset by the decline in electricity prices for projects where electricity is sold under a merchant model. Despite a significant increase in production, Gecama revenues fell 6% year over year to $20m, driven by lower power prices in Spain. During the first quarter last year we sold electricity at Gecama at EUR 85 per MWh versus EUR 65 per MWh for the same period this year. See below for a sensitivity analysis on how Spanish electricity prices have a limited impact on our Financial Outlook.
Finally, the accounting reclassification of the remainder of our financial asset projects in Israel to fixed asset projects boosted revenues by $3m, though at the same time removed this sum from the financial income line item.
Financial performance was well-balanced between Western Europe, Central-Eastern Europe (“CEE”) and Israel, with 64% of revenues in the first quarter of 2024 denominated in Euros, 3% in US Dollars, 1% in other European currencies, and 32% denominated in Israeli shekel.
Net Income
In the first quarter, the Company’s net income decreased from $33m last year to $24m this year, a decline of 27% year over year. The drop can be ascribed to the unusually high financial income incurred during the first quarter last year. In 1Q23, we recorded a one-off $12m benefit caused by the depreciation of the Israeli Shekel on the large amount of cash the Company had received following completion of our Nasdaq IPO in February 2023. In addition, we recorded a $2m non-cash gain in 1Q24 stemming from the mark to market of interest rate hedges and a positive revaluation of foreign exchange-denominated liabilities.
Adjusted EBITDA1
In the first quarter of 2024, the Company’s Adjusted EBITDA grew by 28% to $68m compared to $54m for the same period in 2023. The increase was driven by the same factors which affected our revenue increase, while the company overhead increased by $1m year-on-year.
1 The Company is unable to provide a reconciliation of Adjusted EBITDA to Net Income on a forward-looking basis without unreasonable effort because items that impact this IFRS financial measure are not within the Company’s control and/or cannot be reasonably predicted
Portfolio Overview2
Key changes to the Company’s project portfolio during the first quarter of 2024:
- Operational portfolio grew by 32 MW and 63 MWh
- No material changes to the Mature Project portfolio
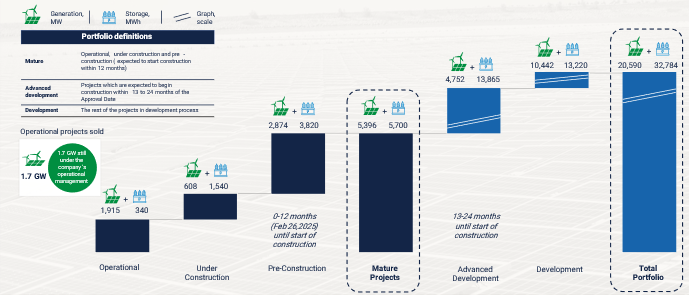
2 As of May 8, 2024, the “Approval Date”
United States
A majority of our Mature Portfolio and development pipeline is located in the US, and this region will soon become our largest market. In 2024, 1.2 GW and 3.2 GWh of projects are either expected to reach commercial operation or commence construction in this region.
Atrisco, comprising 364 MW of solar and 1.2 GWh of battery, is on schedule to reach COD by the end of 2024, with the solar portion during the third quarter and the storage during the fourth quarter. The solar project is mechanically complete and commissioning work is underway. Procurement of the batteries for Atrisco Storage has concluded, and the equipment is almost all on site. Work is now underway to connect the initial circuits, while at the same time we continue to progress on closing the financing and tax equity for the storage element.
We are on target to begin construction at our Quail Ranch, Roadrunner, and Country Acres projects this year, which together total 810 MW of generation and over 2 GWh of energy storage. Country Acres has already reached ready to build status, while our other two projects are awaiting their final milestones before commencing construction. Roadrunner is awaiting final government authorizations needed to proceed, while Quail Ranch is awaiting regulatory approval of its executed PPA. We will begin procurement for all three sites in the coming months, while working in earnest on financing packages which are expected to close during the second half of 2024.
We continue to see a very supportive business environment. Costs for both solar panels and batteries have fallen significantly in recent months. Solar module and battery prices are now approximately 25 cents and $170 respectively, down by 35% since the beginning of 2023. These positive fundamentals are boosting our project returns in the U.S. during 2024 and beyond.
Finally, there has been renewed concern regarding possible new trade sanctions aimed at Asian equipment manufacturers. Clenera uses modules supplied from SE Asia and India that are audited by third parties to ensure compliance with today’s UFLPA and AD/CVD rules. If additional sanctions emerge, we have contingency plans in place to limit potential supply chain impact, including use of U.S. assembled bifacial panels and batteries.
Europe
During the first quarter, the Pupin wind farm in Serbia, with a 94 MW capacity, achieved financial close through a $95m loan arranged by EBRD and Erste. The project is advancing on schedule, with construction having begun in 2Q23, and is expected to reach COD during 2H25. The Tapolca and AC/DC projects in Hungary also reached financial close with a $42m loan from Raiffeisen Bank, resulting in $29m of excess capital recycled back to Enlight. Tapolca, a solar project in Hungary with a capacity of 60 MW, is currently under construction and is on schedule to reach COD during 2H24, while AC/DC, with a generation capacity of 26 MW, is currently operating.
The Gecama Hybrid Solar project with 225 MW of solar and 220 MWh of storage capacity continues to pursue the receipt of its environmental permit from Spanish authorities, which represents the site’s last major development milestone. We are commencing initial engineering work for the project, and subject to receiving the permit, we expect construction to begin during 2H24.
Moving to our operational portfolio, the Gecama Wind project in Spain sold electricity at an average price of EUR 65 per MWh during 1Q24 compared to EUR 85 per MWh last year, as prices fell significantly on the back of high volumes of country-wide renewable power generation. During the quarter, 48% of production was sold at merchant price of EUR 30 per MWh, while 52% of production was sold under a financial hedge at EUR 98 per MWh. The impact of weaker prices was offset by higher-than-usual generation volumes, as well as the hedges we put in place. The volume of electricity generated at Gecama was 20% higher than in 1Q23.
Despite the volatility of electricity prices, Enlight’s hedging strategy provided significant downside protection, and will continue to do so for the rest of the year. Our EUR 100 per MWh hedge will cover 65% of Gecama’s anticipated generation for the rest of 2024, and the sensitivity analysis below demonstrates that our Adjusted EBITDA (taken at the midpoint of the range presented in our Financial Outlook) is only minimally impacted by changes to Spanish electricity prices for the remainder of 2024.
On a broader level, 90% of Enlight’s total generation volumes will be sold at fixed prices this year, whether via PPAs or hedges. Enlight has already begun preparing a hedging strategy for 2025. In this respect, we have entered into futures contracts covering 30% of our estimated generation output for next year at an approximate price of EUR 60 per MWh.
| 2024 Corporate Adjusted EBITDA Sensitivity2 to Spanish Merchant Prices | |||||||||||
| Change in average merchant price for remainder of 2024 (EUR/MWh)1 | -- | -10 | % | -20 | % | -30 | % | -40 | % | -50 | % |
| Change in 2024 Adjusted EBITDA2 | $245m Mid-point EBITDA guidance | -0.5 | % | -0.9 | % | -1.4 | % | -1.8 | % | -2.3 | % |
- Differential from initial 2024 Company budget forecasts of EUR 68.5 / MWh on which the Company’s 2024 Financial Outlook is based at the midpoint.
- Analysis based on the midpoint of the Company’s 2024 financial outlook of $235-$255 in Adjusted EBITDA and a capture rate of 89%. The Company is unable to provide a reconciliation of Adjusted EBITDA to Net Income on a forward-looking basis without unreasonable effort because items that impact this IFRS financial measure are not within the Company’s control and/or cannot be reasonably predicted.
Israel
The build out of the Israel Solar + Storage clusters continued with the COD of Arad Valley 3, adding 30 MW and 63 MWh to this project. This is the seventh unit within the cluster, which will ultimately comprise of 12 sites in the north and center of Israel, with a total capacity of 248 MW and 593 MWh. We expect a gradual COD for the remaining five sites through the rest of this year.
Starting in January 2024, the Israeli electricity sector shifted to a fully deregulated market. Enlight continues to expand its presence in this new commercial environment, signing two new corporate PPAs for an equivalent of capacity 50 MW.
Finally, in April 2024, the Company announced the formation of a new subsidiary named Enlight Local, based on the assets acquired from Aria at the end of last year. Enlight Local will focus on Israeli municipal and agri-solar customers, providing solar and storage infrastructure to this segment of our domestic market, a fast-growing area in which until now Enlight was not active.
Financing Arrangements
During the first quarter of 2024, Enlight achieved two financial closings for projects in Central Europe.
- Project Pupin in Serbia: EBRD and Erste granted a $95m financing package for the construction of the Pupin wind project. It is structured as a fully amortizing 15-year term from the date of COD, with an interest margin of 3.1% to 3.5% above 3-month Euribor.
- Projects Tapolca and AC/DC in Hungary: Raiffeisen Bank granted a $42m senior project financing facility for the construction of the Tapolca solar project, and the recycling of excess equity in AC/DC. The debt is structured with a 10-year tenor with a 25%-35% balloon payment at the end of the term coupled with an interest margin of 3.0% to 3.4% above 3-month Euribor.
The amount of capital raised last year places the Company in a favorable financial position for 2024, and the Company does not anticipate the need to raise equity for our expansion plan. We also note that sell downs of projects from within our pipeline – whether Mature, Advanced Development, or Early-Stage Development– are to become an increasingly important source of funding, which we intend cultivate further in both 2024 and the years ahead. The Company estimates it will generate capital gains of $15m from sell-downs, likely to be realized towards the end of this year. This figure is included in the Adjusted EBITDA portion of our 2024 financial outlook.
Balance Sheet
The Company maintains $325m of revolving credit facilities, none of which have been drawn as of the balance sheet date. These resources enhance our financial strength and provide additional flexibility to the Company as it delivers on its Mature Project portfolio.
| ($ thousands) | March 31, 2024 | |
| Cash and Cash Equivalents: | ||
| Enlight Renewable Energy Ltd, Enlight EU Energies Kft and Enlight Renewable LLC excluding subsidiaries (“Topco”) | 87,637 | |
| Subsidiaries | 162,214 | |
| Deposits: | ||
| Short term deposits | -- | |
| Restricted Cash: | ||
| Projects under construction | 156,098 | |
| Reserves, including debt service, performance obligations and others | 32,347 | |
| Total Cash | 438,296 |
2024 Financial Outlook
Commenting on the outlook, Enlight Chief Financial Officer Nir Yehuda noted, “The Company exhibited robust financial performance during the first quarter. We are therefore pleased to reaffirm our Revenue and Adjusted EBITDA guidance for 2024.” Details of the 2024 outlook include:
- Revenue between $335m and $360m
- Adjusted EBITDA1 between $235m and $255m
- 90% of 2024’s expected generation output will be sold at fixed prices either through hedges or PPAs.
1 The section titled “Non-IFRS Financial Measures” below contains a description of Adjusted EBITDA, a non-IFRS financial measure discussed in this press release. A reconciliation between Adjusted EBITDA and Net Income, its most directly comparable IFRS financial measure, is contained in the tables below. The Company is unable to provide a reconciliation of Adjusted EBITDA to Net Income on a forward-looking basis without unreasonable effort because items that impact this IFRS financial measure are not within the Company’s control and/or cannot be reasonably predicted. These items may include, but are not limited to, forward-looking depreciation and amortization, share based compensation, other income, finance income, finance expenses, share of losses of equity accounted investees and taxes on income. Such information may have a significant, and potentially unpredictable, impact on the Company’s future financial results. We note that “Adjusted EBITDA” measures that we disclosed in previous filings in Israel were not comparable to “Adjusted EBITDA” disclosed in the release and in our future filings.
Conference Call Information
Enlight plans to hold its First Quarter 2024 Conference Call and Webcast on Wednesday, May 8, 2024 at 8:00 a.m. ET to review its financial results and business outlook. Management will deliver prepared remarks followed by a question-and-answer session. Participants can join by dial-in or webcast:
- Conference Call:
Please dial-in using the following phone numbers, requesting conference ID 4954929:- United States/Canada Toll Free: 1 (800) 715-9871
- International Toll: +1 (646) 307-1963
- For participants in Israel: (03) 376-1144
- Webcast:
Please register and join by webcast at the following link: https://edge.media-server.com/mmc/p/3zqpmx44
The press release with the financial results as well as the investor presentation materials will be accessible from the Company’s website prior to the conference call. Approximately one hour after completion of the live call, an archived version of the webcast will be available on the Company’s investor relations website at https://enlightenergy.co.il/info/investors/.
Supplemental Financial and Other Information
We intend to announce material information to the public through the Enlight investor relations website at https://enlightenergy.co.il/info/investors, SEC filings, press releases, public conference calls, and public webcasts. We use these channels to communicate with our investors, customers, and the public about our company, our offerings, and other issues. As such, we encourage investors, the media, and others to follow the channels listed above, and to review the information disclosed through such channels. Any updates to the list of disclosure channels through which we will announce information will be posted on the investor relations page of our website.
Non-IFRS Financial Measures
This release presents Adjusted EBITDA, a financial metric, which is provided as a complement to the results provided in accordance with the International Financial Reporting Standards as issued by the International Accounting Standards Board (“IFRS”). A reconciliation of the non-IFRS financial information to the most directly comparable IFRS financial measure is provided in the accompanying tables found at the end of this release.
We define Adjusted EBITDA as net income (loss) plus depreciation and amortization, share based compensation, finance expenses, taxes on income and share in losses of equity accounted investees and minus finance income and non-recurring other income. Non-recurring other income for the first quarter of 2024 included income recognized in relation to the reduction of earnout we expect to pay as part of the Clenera Acquisition and other income recognized in relation to tax credits for projects in the United States. With respect to other expense (income), as part of Enlight’s strategy to accelerate growth and reduce the need for equity financing, the Company sells parts of, or entire, developed assets from time to time, and therefore includes realized gains and losses from these asset dispositions in Adjusted EBITDA. Our management believes Adjusted EBITDA is indicative of operational performance and ongoing profitability and uses Adjusted EBITDA to evaluate the operating performance and for planning and forecasting purposes.
Non-IFRS financial measures have limitations as analytical tools and should not be considered in isolation or as substitutes for financial information presented under IFRS. There are a number of limitations related to the use of non-IFRS financial measures versus comparable financial measures determined under IFRS. For example, other companies in our industry may calculate the non-IFRS financial measures that we use differently or may use other measures to evaluate their performance. All of these limitations could reduce the usefulness of our non-IFRS financial measures as analytical tools. Investors are encouraged to review the related IFRS financial measure, Net Income, and the reconciliations of Adjusted EBITDA provided below to Net Income and to not rely on any single financial measure to evaluate our business.
Special Note Regarding Forward-Looking Statements
This press release contains forward-looking statements within the meaning of the U.S. Private Securities Litigation Reform Act of 1995. We intend such forward-looking statements to be covered by the safe harbor provisions for forward-looking statements as contained in Section 27A of the Securities Act of 1933, as amended, and Section 21E of the Securities Exchange Act of 1934, as amended. All statements contained in this press release other than statements of historical fact, including, without limitation, statements regarding the Company’s business strategy and plans, capabilities of the Company’s project portfolio and achievement of operational objectives, market opportunity, utility demand and potential growth, discussions with commercial counterparties and financing sources, pricing trends for materials, progress of Company projects, including anticipated timing of related approvals and project completion and anticipated production delays, the Company’s future financial results, expected impact from various regulatory developments and anticipated trade sanctions, expectations regarding wind production, electricity prices and windfall taxes, and Revenue and Adjusted EBITDA guidance, the expected timing of completion of our ongoing projects, and the Company’s anticipated cash requirements and financing plans , are forward-looking statements. The words “may,” “might,” “will,” “could,” “would,” “should,” “expect,” “plan,” “anticipate,” “intend,” “target,” “seek,” “believe,” “estimate,” “predict,” “potential,” “continue,” “contemplate,” “possible,” “forecasts,” “aims” or the negative of these terms and similar expressions are intended to identify forward-looking statements, though not all forward-looking statements use these words or expressions.
These statements are neither promises nor guarantees, but involve known and unknown risks, uncertainties and other important factors that may cause our actual results, performance or achievements to be materially different from any future results, performance or achievements expressed or implied by the forward-looking statements, including, but not limited to, the following: our ability to site suitable land for, and otherwise source, renewable energy projects and to successfully develop and convert them into Operational Projects; availability of, and access to, interconnection facilities and transmission systems; our ability to obtain and maintain governmental and other regulatory approvals and permits, including environmental approvals and permits; construction delays, operational delays and supply chain disruptions leading to increased cost of materials required for the construction of our projects, as well as cost overruns and delays related to disputes with contractors; disruptions in trade caused by political, social or economic instability in regions where our components and materials are made; our suppliers’ ability and willingness to perform both existing and future obligations; competition from traditional and renewable energy companies in developing renewable energy projects; potential slowed demand for renewable energy projects and our ability to enter into new offtake contracts on acceptable terms and prices as current offtake contracts expire; offtakers’ ability to terminate contracts or seek other remedies resulting from failure of our projects to meet development, operational or performance benchmarks; exposure to market prices in some of our offtake contracts; various technical and operational challenges leading to unplanned outages, reduced output, interconnection or termination issues; the dependence of our production and revenue on suitable meteorological and environmental conditions, and our ability to accurately predict such conditions; our ability to enforce warranties provided by our counterparties in the event that our projects do not perform as expected; government curtailment, energy price caps and other government actions that restrict or reduce the profitability of renewable energy production; electricity price volatility, unusual weather conditions (including the effects of climate change, could adversely affect wind and solar conditions), catastrophic weather-related or other damage to facilities, unscheduled generation outages, maintenance or repairs, unanticipated changes to availability due to higher demand, shortages, transportation problems or other developments, environmental incidents, or electric transmission system constraints and the possibility that we may not have adequate insurance to cover losses as a result of such hazards; our dependence on certain operational projects for a substantial portion of our cash flows; our ability to continue to grow our portfolio of projects through successful acquisitions; changes and advances in technology that impair or eliminate the competitive advantage of our projects or upsets the expectations underlying investments in our technologies; our ability to effectively anticipate and manage cost inflation, interest rate risk, currency exchange fluctuations and other macroeconomic conditions that impact our business; our ability to retain and attract key personnel; our ability to manage legal and regulatory compliance and litigation risk across our global corporate structure; our ability to protect our business from, and manage the impact of, cyber-attacks, disruptions and security incidents, as well as acts of terrorism or war; changes to existing renewable energy industry policies and regulations that present technical, regulatory and economic barriers to renewable energy projects; the reduction, elimination or expiration of government incentives for, or regulations mandating the use of, renewable energy; our ability to effectively manage the global expansion of the scale of our business operations; our ability to perform to expectations in our new line of business involving the construction of PV systems for municipalities in Israel; our ability to effectively manage our supply chain and comply with applicable regulations with respect to international trade relations, tariffs, sanctions, export controls and anti-bribery and anti-corruption laws; our ability to effectively comply with Environmental Health and Safety and other laws and regulations and receive and maintain all necessary licenses, permits and authorizations; our performance of various obligations under the terms of our indebtedness (and the indebtedness of our subsidiaries that we guarantee) and our ability to continue to secure project financing on attractive terms for our projects; limitations on our management rights and operational flexibility due to our use of tax equity arrangements; potential claims and disagreements with partners, investors and other counterparties that could reduce our right to cash flows generated by our projects; our ability to comply with increasingly complex tax laws of various jurisdictions in which we currently operate as well as the tax laws in jurisdictions in which we intend to operate in the future; the unknown effect of the dual listing of our ordinary shares on the price of our ordinary shares; various risks related to our incorporation and location in Israel, including the ongoing war in Israel, where our headquarters and some of our wind energy and solar energy projects are located; the costs and requirements of being a public company, including the diversion of management’s attention with respect to such requirements; certain provisions in our Articles of Association and certain applicable regulations that may delay or prevent a change of control; and other risk factors set forth in the section titled “Risk factors” in our Annual Report on Form 20-F for the fiscal year ended December 31, 2023, filed with the Securities and Exchange Commission (the “SEC”), as may be updated in our other documents filed with or furnished to the SEC.
These statements reflect management’s current expectations regarding future events and operating performance and speak only as of the date of this press release. You should not put undue reliance on any forward-looking statements. Although we believe that the expectations reflected in the forward-looking statements are reasonable, we cannot guarantee that future results, levels of activity, performance and events and circumstances reflected in the forward-looking statements will be achieved or will occur. Except as required by applicable law, we undertake no obligation to update or revise publicly any forward-looking statements, whether as a result of new information, future events or otherwise, after the date on which the statements are made or to reflect the occurrence of unanticipated events.
About Enlight
Founded in 2008, Enlight develops, finances, constructs, owns, and operates utility-scale renewable energy projects. Enlight operates across the three largest renewable segments today: solar, wind and energy storage. A global platform, Enlight operates in the United States, Israel and 9 European countries. Enlight has been traded on the Tel Aviv Stock Exchange since 2010 (TASE: ENLT) and completed its U.S. IPO (Nasdaq: ENLT) in 2023.
Company Contacts
Yonah Weisz
Director IR
investors@enlightenergy.co.il
Erica Mannion or Mike Funari
Sapphire Investor Relations, LLC
+1 617 542 6180
investors@enlightenergy.co.il
| Appendix 1 – Financial information | |||||||
| Consolidated Statements of Income | |||||||
| For the three months ended at March 31 | |||||||
| 2024 | 2023 | ||||||
| USD in | USD in | ||||||
| Thousands | Thousands | ||||||
| Revenues | 90,397 | 70,994 | |||||
| Cost of sales | (15,436 | ) | (10,253 | ) | |||
| Depreciation and amortization | (24,732 | ) | (12,750 | ) | |||
| Gross profit | 50,229 | 47,991 | |||||
| General and administrative expenses | (9,731 | ) | (8,073 | ) | |||
| Development expenses | (2,418 | ) | (1,375 | ) | |||
| Other income | 4,808 | 505 | |||||
| (7,341 | ) | (8,943 | ) | ||||
| Operating profit | 42,888 | 39,048 | |||||
| Finance income | 8,065 | 20,377 | |||||
| Finance expenses | (19,493 | ) | (16,363 | ) | |||
| Total finance income (expenses), net | (11,428 | ) | 4,014 | ||||
| Profit before tax and equity loss | 31,460 | 43,062 | |||||
| Share of losses of equity accounted investees | (144 | ) | (205 | ) | |||
| Profit before income taxes | 31,316 | 42,857 | |||||
| Taxes on income | (6,831 | ) | (9,581 | ) | |||
| Profit for the period | 24,485 | 33,276 | |||||
| Profit for the period attributed to: | |||||||
| Owners of the Company | 16,763 | 23,994 | |||||
| Non-controlling interests | 7,722 | 9,282 | |||||
| 24,485 | 33,276 | ||||||
| Earnings per ordinary share (in USD) with a par value of NIS 0.1, attributable to owners of the parent Company: | |||||||
| Basic earnings per share | 0.14 | 0.22 | |||||
| Diluted earnings per share | 0.14 | 0.20 | |||||
| Weighted average of share capital used in the calculation of earnings: | |||||||
| Basic per share | 117,963,310 | 109,445,475 | |||||
| Diluted per share | 122,889,909 | 117,820,495 | |||||
| Consolidated Statements of Financial Position as of | |||||||
| March 31 | December 31 | ||||||
| 2024 | 2023 | ||||||
| USD in | USD in | ||||||
| Thousands | Thousands | ||||||
| Assets | |||||||
| Current assets | |||||||
| Cash and cash equivalents | 249,851 | 403,805 | |||||
| Deposits in banks | - | 5,308 | |||||
| Restricted cash | 156,098 | 142,695 | |||||
| Trade receivables | 59,002 | 43,100 | |||||
| Other receivables | 73,596 | 60,691 | |||||
| Current maturities of contract assets | - | 8,070 | |||||
| Other financial assets | 1,764 | 976 | |||||
| Total current assets | 540,311 | 664,645 | |||||
| Non-current assets | |||||||
| Restricted cash | 32,347 | 38,891 | |||||
| Other long-term receivables | 31,073 | 32,540 | |||||
| Deferred costs in respect of projects | 291,407 | 271,424 | |||||
| Deferred borrowing costs | 995 | 493 | |||||
| Loans to investee entities | 45,315 | 35,878 | |||||
| Contract assets | - | 91,346 | |||||
| Fixed assets, net | 3,122,798 | 2,947,369 | |||||
| Intangible assets, net | 288,494 | 287,961 | |||||
| Deferred taxes assets | 9,749 | 9,134 | |||||
| Right-of-use asset, net | 123,042 | 121,348 | |||||
| Financial assets at fair value through profit or loss | 63,430 | 53,466 | |||||
| Other financial assets | 84,499 | 79,426 | |||||
| Total non-current assets | 4,093,149 | 3,969,276 | |||||
| Total assets | 4,633,460 | 4,633,921 | |||||
| Consolidated Statements of Financial Position as of (Cont.) | |||||
| March 31 | December 31 | ||||
| 2024 | 2023 | ||||
| USD in | USD in | ||||
| Thousands | Thousands | ||||
| Liabilities and equity | |||||
| Current liabilities | |||||
| Credit and current maturities of loans from banks and other financial institutions | 357,430 | 324,666 | |||
| Trade payables | 65,479 | 105,574 | |||
| Other payables | 102,200 | 103,622 | |||
| Current maturities of debentures | 25,848 | 26,233 | |||
| Current maturities of lease liability | 9,956 | 8,113 | |||
| Financial liabilities through profit or loss | 12,383 | 13,860 | |||
| Other financial liabilities | 1,154 | 1,224 | |||
| Total current liabilities | 574,450 | 583,292 | |||
| Non-current liabilities | |||||
| Debentures | 288,939 | 293,751 | |||
| Other financial liabilities | 55,793 | 62,020 | |||
| Convertible debentures | 129,431 | 130,566 | |||
| Loans from banks and other financial institutions | 1,705,609 | 1,702,925 | |||
| Loans from non-controlling interests | 92,050 | 92,750 | |||
| Financial liabilities through profit or loss | 33,346 | 34,524 | |||
| Deferred taxes liabilities | 47,872 | 44,941 | |||
| Employee benefits | 4,724 | 4,784 | |||
| Lease liability | 117,834 | 119,484 | |||
| Other payables | 57,617 | 60,880 | |||
| Asset retirement obligation | 66,892 | 68,047 | |||
| Total non-current liabilities | 2,600,107 | 2,614,672 | |||
| Total liabilities | 3,174,557 | 3,197,964 | |||
| Equity | |||||
| Ordinary share capital | 3,293 | 3,293 | |||
| Share premium | 1,028,532 | 1,028,532 | |||
| Capital reserves | 59,535 | 57,730 | |||
| Proceeds on account of convertible options | 15,494 | 15,494 | |||
| Accumulated profit | 80,473 | 63,710 | |||
| Equity attributable to shareholders of the Company | 1,187,327 | 1,168,759 | |||
| Non-controlling interests | 271,576 | 267,198 | |||
| Total equity | 1,458,903 | 1,435,957 | |||
| Total liabilities and equity | 4,633,460 | 4,633,921 | |||
| Consolidated Statements of Cash Flows | ||||||
| For the three months ended at March 31 | ||||||
| 2024 | 2023 | |||||
| USD in | USD in | |||||
| Thousands | Thousands | |||||
| Cash flows for operating activities | ||||||
| Profit for the period | 24,485 | 33,276 | ||||
| Income and expenses not associated with cash flows: | ||||||
| Depreciation and amortization | 25,604 | 13,140 | ||||
| Finance expenses, net | 11,486 | 6,346 | ||||
| Share-based compensation | 3,117 | 1,389 | ||||
| Taxes on income | 6,831 | 9,581 | ||||
| Other income, net | (3,425 | ) | (505 | ) | ||
| Company’s share in losses of investee partnerships | 144 | 205 | �� | |||
| 43,757 | 30,156 | |||||
| Changes in assets and liabilities items: | ||||||
| Change in other receivables | (2,142 | ) | 2,322 | |||
| Change in trade receivables | (16,909 | ) | (2,384 | ) | ||
| Change in other payables | (539 | ) | (3,413 | ) | ||
| Change in trade payables | 71 | 807 | ||||
| (19,519 | ) | (2,668 | ) | |||
| Interest receipts | 2,928 | 4,551 | ||||
| Interest paid | (15,624 | ) | (12,064 | ) | ||
| Income Tax paid | (798 | ) | (448 | ) | ||
| Repayment of contract assets | - | 2,640 | ||||
| Net cash from operating activities | 35,229 | 55,443 | ||||
| Cash flows for investing activities | ||||||
| Acquisition of consolidated entities | (1,388 | ) | - | |||
| Changes in restricted cash and bank deposits, net | (4,988 | ) | 20,086 | |||
| Purchase, development, and construction in respect of projects | (199,733 | ) | (148,778 | ) | ||
| Proceeds from sale (purchase) of short-term financial assets | - | 661 | ||||
| measured at fair value through profit or loss, net | ||||||
| Loans provided and Investment in investees | (11,284 | ) | (309 | ) | ||
| Repayments of loans from investees | - | 12,555 | ||||
| Payments on account of acquisition of consolidated company | (10,851 | ) | (1,073 | ) | ||
| Purchase of long-term financial assets measured at fair value | (8,409 | ) | (3,204 | ) | ||
| through profit or loss | ||||||
| Net cash used in investing activities | (236,653 | ) | (120,062 | ) | ||
| Consolidated Statements of Cash Flows (Cont.) | ||||||
| For the three months ended at March 31 | ||||||
| 2024 | 2023 | |||||
| USD in | USD in | |||||
| Thousands | Thousands | |||||
| Cash flows from financing activities | ||||||
| Receipt of loans from banks and other financial institutions | 71,371 | 169,541 | ||||
| Repayment of loans from banks and other financial institutions | (10,448 | ) | (13,135 | ) | ||
| Repayment of debentures | (1,284 | ) | (1,300 | ) | ||
| Dividends and distributions by subsidiaries to non-controlling interests | (108 | ) | (1,980 | ) | ||
| Deferred borrowing costs | (2,682 | ) | (1,005 | ) | ||
| Repayment of loans from non-controlling interests | (955 | ) | (663 | ) | ||
| Issuance of shares | - | 264,045 | ||||
| Repayment of lease liability | (3,671 | ) | (2,395 | ) | ||
| Proceeds from investment in entities by non- controlling interest | 152 | 2,679 | ||||
| Net cash from financing activities | 52,375 | 415,787 | ||||
| Increase (Decrease) in cash and cash equivalents | (149,049 | ) | 351,168 | |||
| Balance of cash and cash equivalents at beginning of year | 403,805 | 193,869 | ||||
| Effect of exchange rate fluctuations on cash and cash equivalents | (4,905 | ) | (2,570 | ) | ||
| Cash and cash equivalents at end of period | 249,851 | 542,467 | ||||
Segmental Reporting
| For the three months ended March 31, 2024 | |||||||||||
| Israel | Central-Eastern Europe | Western Europe | USA | Management and construction | Total reportable segments | Adjustments | Total | ||||
| USD in thousands | |||||||||||
| External revenues | 28,474 | 27,999 | 31,161 | 1,231 | 1,532 | 90,397 | - | 90,397 | |||
| Inter-segment revenues | - | - | - | - | 1,456 | 1,456 | (1,456 | ) | - | ||
| Total revenues | 28,474 | 27,999 | 31,161 | 1,231 | 2,988 | 91,853 | (1,456 | ) | 90,397 | ||
| Segment Adjusted | |||||||||||
| EBITDA | 24,528 | 24,353 | 26,354 | (142 | ) | 668 | 75,761 | - | 75,761 | ||
| Reconciliations of unallocated amounts: | |||||||||||
| Headquarter costs (*) | (7,606 | ) | |||||||||
| Intersegment profit | 190 | ||||||||||
| Depreciation and amortization and share-based compensation | (28,721 | ) | |||||||||
| Other incomes not attributed to segments | 3,264 | ||||||||||
| Operating profit | 42,888 | ||||||||||
| Finance income | 8,065 | ||||||||||
| Finance expenses | (19,493 | ) | |||||||||
| Share in the losses of equity accounted investees | (144 | ) | |||||||||
| Profit before income taxes | 31,316 | ||||||||||
(*) Including general and administrative and development expenses (excluding depreciation and amortization and share based compensation).
Segmental Reporting
| For the three months ended March 31, 2023 | |||||||||
| Israel | Central-Eastern Europe | Western Europe | Management and construction | Total reportable segments | Adjustments | Total | |||
| USD in thousands | |||||||||
| External revenues | 13,838 | 23,235 | 31,788 | 2,133 | 70,994 | - | 70,994 | ||
| Inter-segment revenues | - | - | - | 1,396 | 1,396 | (1,396 | ) | - | |
| Total revenues | 13,838 | 23,235 | 31,788 | 3,529 | 72,390 | (1,396 | ) | 70,994 | |
| Segment Adjusted | |||||||||
| EBITDA | 13,463 | 19,747 | 27,907 | 751 | 61,868 | - | 61,868 | ||
| Reconciliations of unallocated amounts: | |||||||||
| Headquarter costs (*) | (6,055 | ) | |||||||
| Intersegment profit | 404 | ||||||||
| Repayment of contract asset under concession arrangements | (2,640 | ) | |||||||
| Depreciation and amortization and share-based compensation | (14,529 | ) | |||||||
| Operating profit | 39,048 | ||||||||
| Finance income | 20,377 | ||||||||
| Finance expenses | (16,363 | ) | |||||||
| Share in the losses of equity accounted investees | (205 | ) | |||||||
| Profit before income taxes | 42,857 | ||||||||
(*) Including general and administrative and development expenses (excluding depreciation and amortization and share based compensation)
| Appendix 2 - Reconciliations between Net Income to Adjusted EBITDA | ||||
| ($ thousands) | For the three months ended at | |||
| March 31, 2024 | March 31, 2023 | |||
| Net Income | 24,485 | 33,276 | ||
| Depreciation and amortization | 25,604 | 13,140 | ||
| Share-based compensation | 3,117 | 1,389 | ||
| Finance income | (8,065 | ) | (20,377 | ) |
| Finance expenses | 19,493 | 16,363 | ||
| Non-recurring other income (*) | (3,264 | ) | - | |
| Share of losses of equity accounted investees | 144 | 205 | ||
| Taxes on income | 6,831 | 9,581 | ||
| Adjusted EBITDA | 68,345 | 53,577 | ||
| * Non-recurring other income comprised the recognition of income related to other income recognized in relation to tax credits for projects in the United States | ||||
A photo accompanying this announcement is available at https://www.globenewswire.com/NewsRoom/AttachmentNg/4eabeaaa-b4de-4967-9f75-42867b2dc52b

![]()


