
Commercial vehicle retailer Rush Enterprises (NASDAQ: RUSH.A) reported Q2 CY2025 results exceeding the market’s revenue expectations, but sales fell by 4.8% year on year to $1.93 billion. Its GAAP profit of $0.90 per share was 12.5% above analysts’ consensus estimates.
Is now the time to buy Rush Enterprises? Find out by accessing our full research report, it’s free.
Rush Enterprises (RUSHA) Q2 CY2025 Highlights:
- Revenue: $1.93 billion vs analyst estimates of $1.90 billion (4.8% year-on-year decline, 1.6% beat)
- EPS (GAAP): $0.90 vs analyst estimates of $0.80 (12.5% beat)
- Adjusted EBITDA: $127.8 million vs analyst estimates of $156.2 million (6.6% margin, 18.2% miss)
- Operating Margin: 5.7%, in line with the same quarter last year
- Market Capitalization: $4.25 billion
“The second quarter of 2025 continued to present challenges for commercial truck operators and the broader industry that supports them. While there have been sporadic signs of recovery from the freight recession that has impacted over-the-road carriers for more than two years, freight rates remain depressed, and overcapacity persists. In addition, ongoing economic uncertainty, particularly around U.S. trade policy and its potential impact on the supply chain and overall economy, combined with a lack of clarity regarding engine emissions regulations, has led many customers to delay vehicle acquisition and maintenance decisions,” said W.M. “Rusty” Rush, Chairman, Chief Executive Officer and President of Rush Enterprises,
Company Overview
Headquartered in Texas, Rush Enterprises (NASDAQ: RUSH.A) provides truck-related services and solutions, including sales, leasing, parts, and maintenance for commercial vehicles.
Revenue Growth
Reviewing a company’s long-term sales performance reveals insights into its quality. Any business can put up a good quarter or two, but the best consistently grow over the long haul. Over the last five years, Rush Enterprises grew its sales at a decent 8.1% compounded annual growth rate. Its growth was slightly above the average industrials company and shows its offerings resonate with customers.
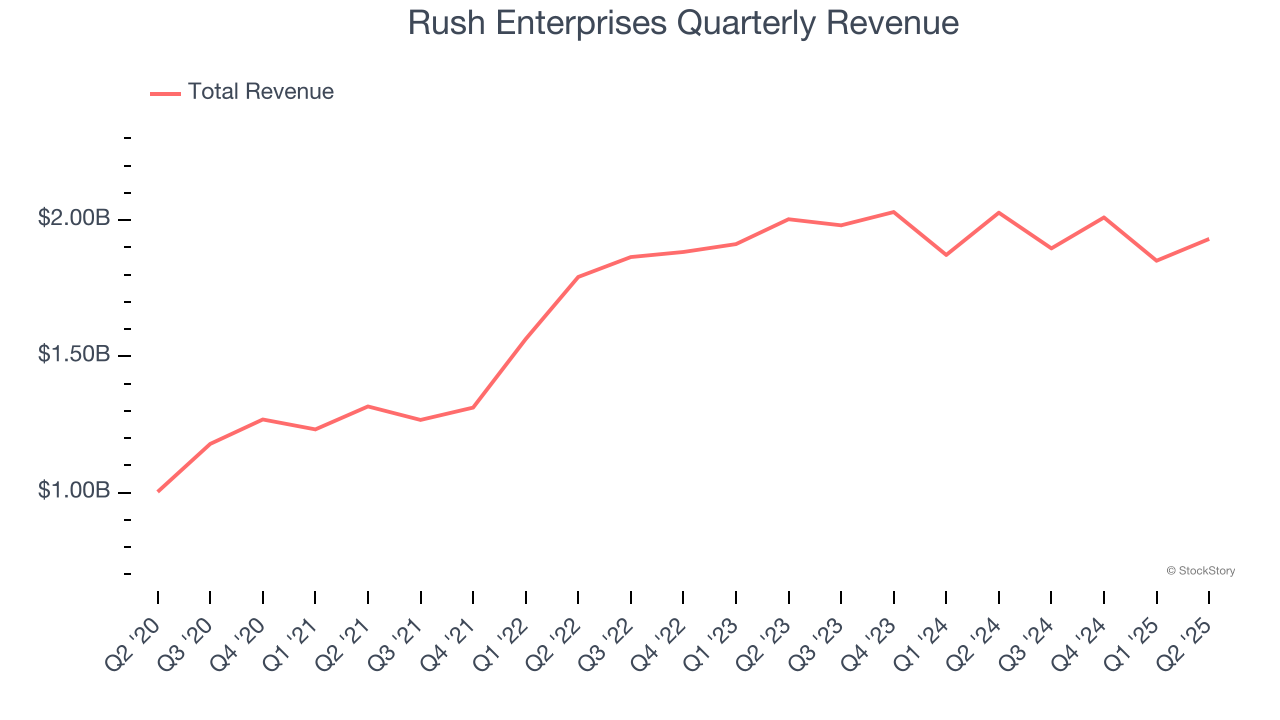
Long-term growth is the most important, but within industrials, a half-decade historical view may miss new industry trends or demand cycles. Rush Enterprises’s recent performance shows its demand has slowed as its revenue was flat over the last two years. 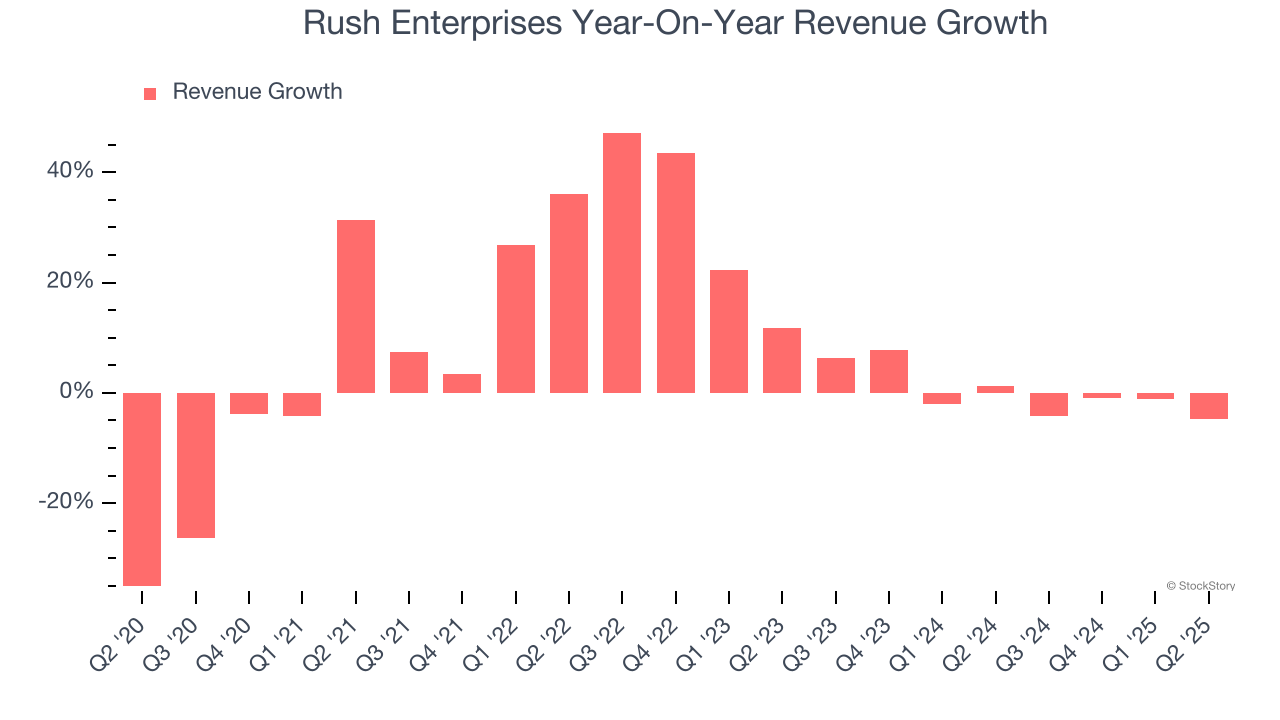
We can better understand the company’s revenue dynamics by analyzing its most important segments, Vehicles and Aftermarket, which are 61.7% and 33% of revenue. Over the last two years, Rush Enterprises’s Vehicles (new and used commercial trucks) and Aftermarket (parts and services) revenues were flat.
This quarter, Rush Enterprises’s revenue fell by 4.8% year on year to $1.93 billion but beat Wall Street’s estimates by 1.6%.
Looking ahead, sell-side analysts expect revenue to grow 3.9% over the next 12 months. Although this projection implies its newer products and services will spur better top-line performance, it is still below the sector average.
Software is eating the world and there is virtually no industry left that has been untouched by it. That drives increasing demand for tools helping software developers do their jobs, whether it be monitoring critical cloud infrastructure, integrating audio and video functionality, or ensuring smooth content streaming. Click here to access a free report on our 3 favorite stocks to play this generational megatrend.
Operating Margin
Operating margin is an important measure of profitability as it shows the portion of revenue left after accounting for all core expenses – everything from the cost of goods sold to advertising and wages. It’s also useful for comparing profitability across companies with different levels of debt and tax rates because it excludes interest and taxes.
Rush Enterprises was profitable over the last five years but held back by its large cost base. Its average operating margin of 6.1% was weak for an industrials business. This result isn’t too surprising given its low gross margin as a starting point.
On the plus side, Rush Enterprises’s operating margin rose by 1.1 percentage points over the last five years, as its sales growth gave it operating leverage.
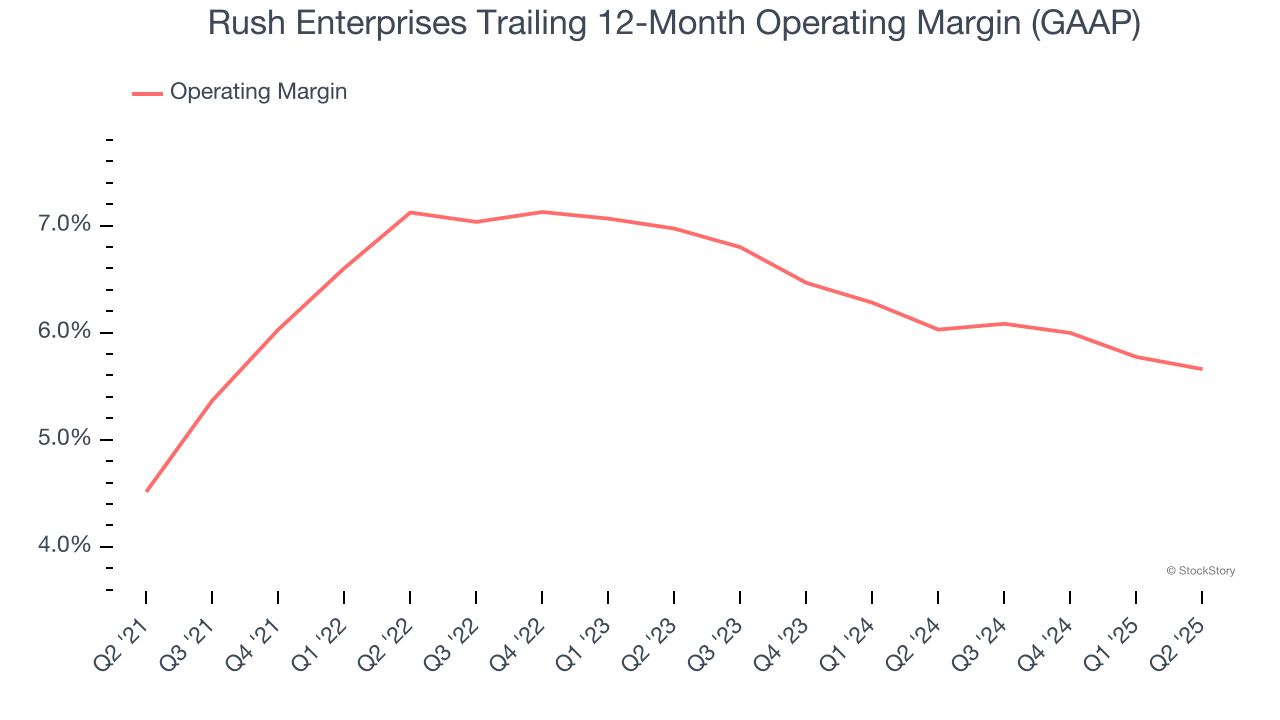
This quarter, Rush Enterprises generated an operating margin profit margin of 5.7%, in line with the same quarter last year. This indicates the company’s cost structure has recently been stable.
Earnings Per Share
Revenue trends explain a company’s historical growth, but the long-term change in earnings per share (EPS) points to the profitability of that growth – for example, a company could inflate its sales through excessive spending on advertising and promotions.
Rush Enterprises’s EPS grew at an astounding 23.4% compounded annual growth rate over the last five years, higher than its 8.1% annualized revenue growth. This tells us the company became more profitable on a per-share basis as it expanded.
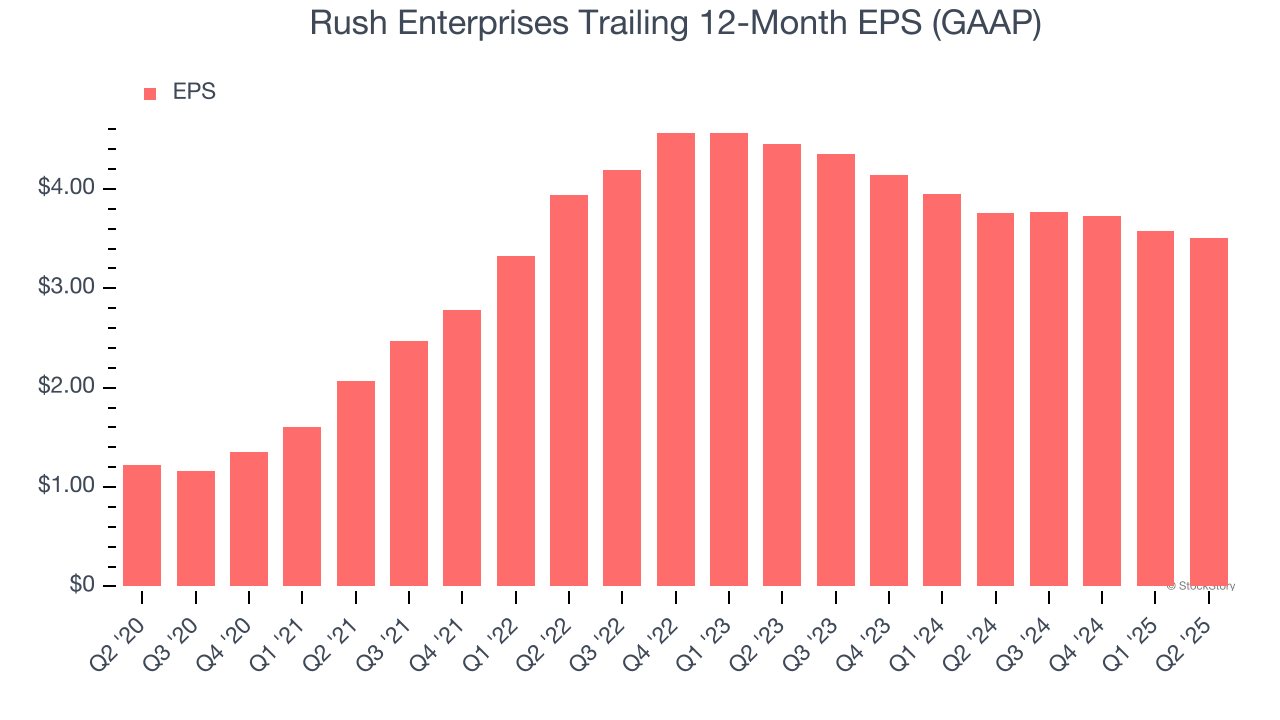
We can take a deeper look into Rush Enterprises’s earnings quality to better understand the drivers of its performance. As we mentioned earlier, Rush Enterprises’s operating margin was flat this quarter but expanded by 1.1 percentage points over the last five years. On top of that, its share count shrank by 3.1%. These are positive signs for shareholders because improving profitability and share buybacks turbocharge EPS growth relative to revenue growth. 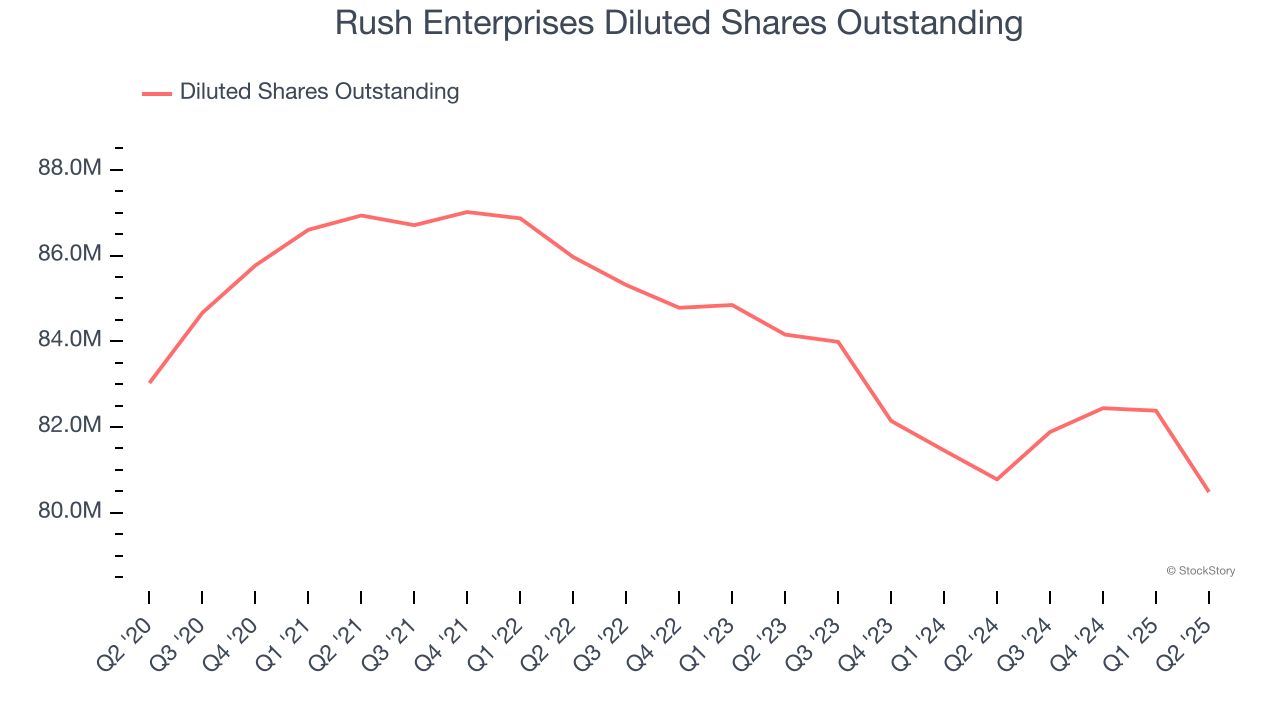
Like with revenue, we analyze EPS over a more recent period because it can provide insight into an emerging theme or development for the business.
For Rush Enterprises, its two-year annual EPS declines of 11.3% mark a reversal from its (seemingly) healthy five-year trend. We hope Rush Enterprises can return to earnings growth in the future.
In Q2, Rush Enterprises reported EPS at $0.90, down from $0.97 in the same quarter last year. Despite falling year on year, this print easily cleared analysts’ estimates. We also like to analyze expected EPS growth based on Wall Street analysts’ consensus projections, but there is insufficient data.
Key Takeaways from Rush Enterprises’s Q2 Results
We enjoyed seeing Rush Enterprises exceed analysts’ Aftermarket revenue expectations this quarter. We were also happy its EPS outperformed Wall Street’s estimates. On the other hand, its EBITDA missed. Overall, this was a weaker quarter. The stock remained flat at $53.12 immediately following the results.
Should you buy the stock or not? We think that the latest quarter is only one piece of the longer-term business quality puzzle. Quality, when combined with valuation, can help determine if the stock is a buy. We cover that in our actionable full research report which you can read here, it’s free.


