Marine transportation service company Kirby (NYSE: KEX) announced better-than-expected revenue in Q3 2026, with revenue up 12.2% year on year to $977.2 million. Its GAAP profit of $2.09 per share was 6.8% above analysts’ consensus estimates.
For more on Kirby, read our free full research report.
Kirby (KEX) Q3 2026 highlights:
- Revenue $977.2 million vs S&P analysts’ consensus estimates of $937.5 million (12.2% year-on-year growth, 4.2% beat)
- EPS (GAAP) $2.09 vs analysts’ consensus estimates of $1.96 (6.8% beat)
- Adjusted EBITDA $229.7 million vs analysts’ consensus estimates of $216.5 million (23.5% margin, 6.1% beat)
- Operating margin 15.4%, in line with the same quarter last year
- Free cash flow margin 7.6%, down from 18.4% in the same quarter last year
- Market capitalization $7.24 billion
David Grzebinski, Kirby’s Chief Executive Officer, commented, “Our third quarter results reflected strong continued momentum across both businesses and solid execution throughout the organization. In marine transportation, strong barge utilization and favorable pricing trends supported performance during the quarter, though rising fuel costs continued to impact margins. In distribution and services, results benefited from robust demand in power generation and the strong growth of behind-the-meter solutions. Overall, the company executed well during the quarter and delivered solid financial and operating results, reflecting our continued focus on safety and operational excellence.”
Revenue growth
A company’s long-term revenue performance can indicate its overall quality. Any business can report a good quarter or two, but the best consistently grow over the long haul. Over the last five years, Kirby grew its revenue at an impressive 10.9% compounded annual growth rate. Its growth surpassed the average industrials company and shows its offerings resonate with customers.
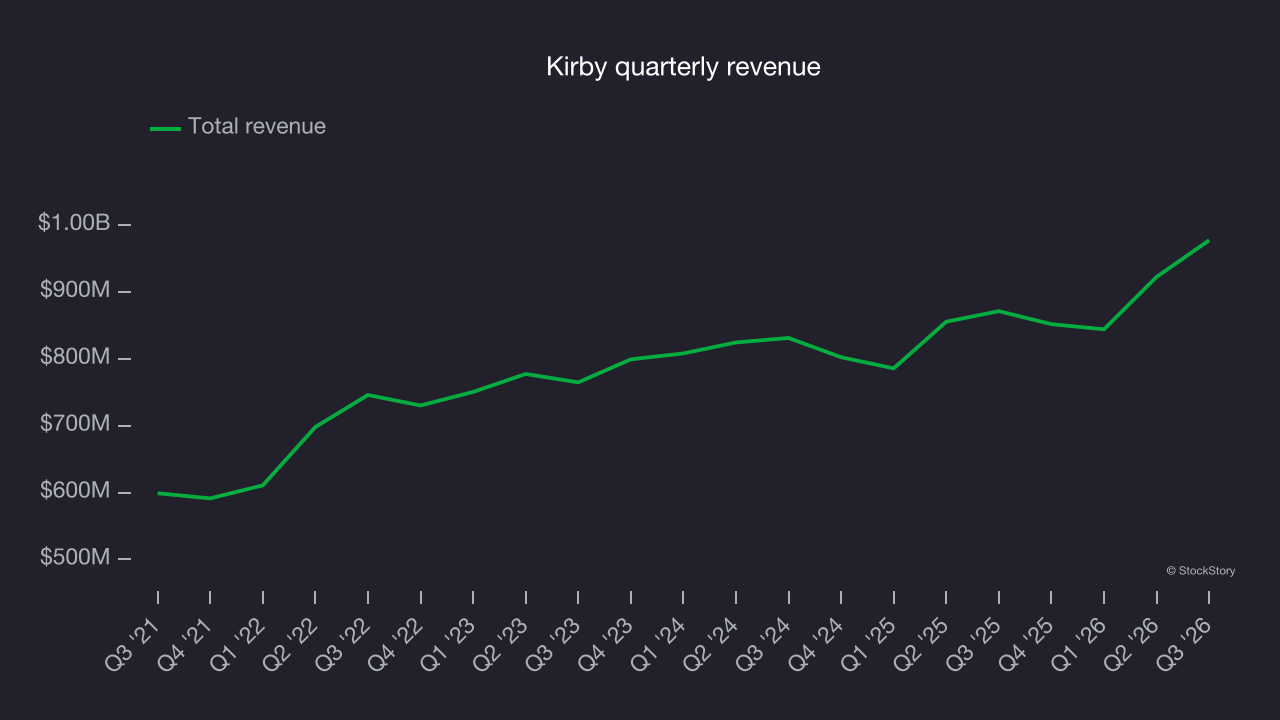
Long-term growth matters most, but within industrials, a half-decade historical view may miss cycles, industry trends or a company capitalizing on catalysts such as a new contract win or a successful product line. Kirby’s recent performance shows its demand has slowed significantly as its annualized revenue growth of 5% over the last two years was well below its five-year trend. 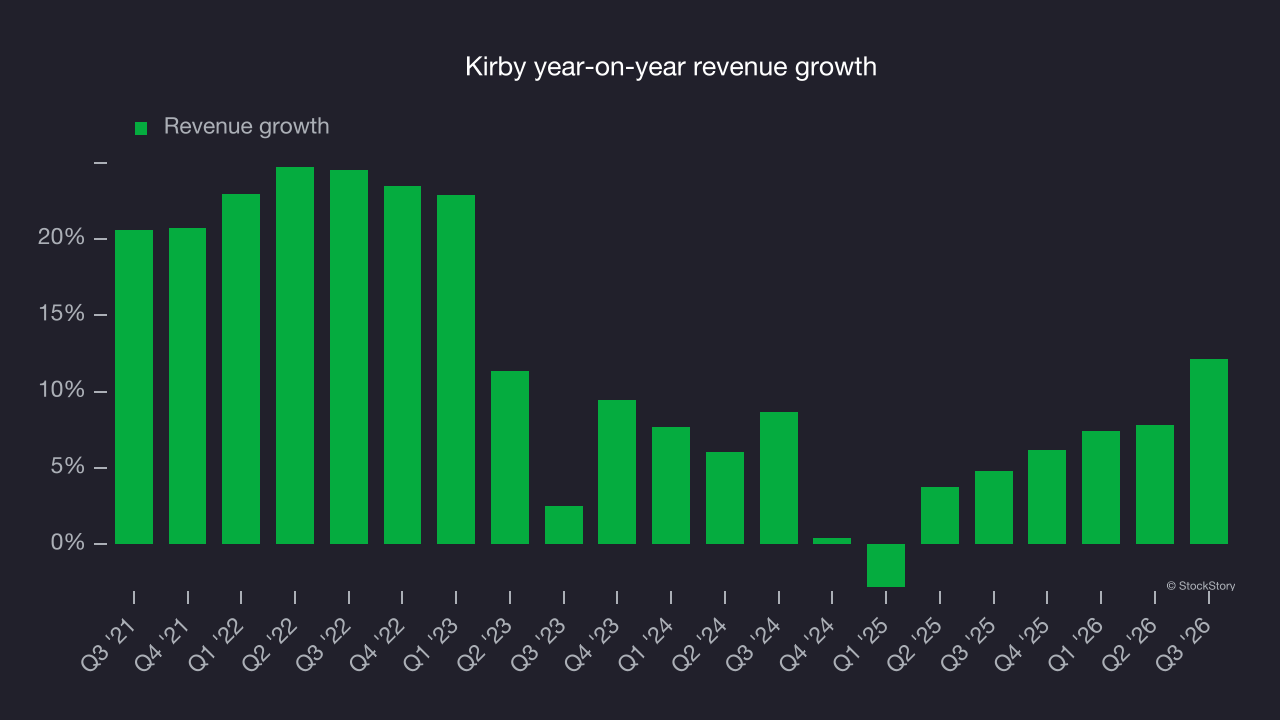
Kirby also breaks out the revenue for its most important segments, Marine Transportation and Distribution and Services, which are 58.2% and 41.8% of revenue. Over the last two years, Kirby’s Marine Transportation revenue (petroleum products and chemicals) averaged 5.1% year-on-year growth while its Distribution and Services revenue (aftermarket parts and equipment) averaged 6.6% growth. 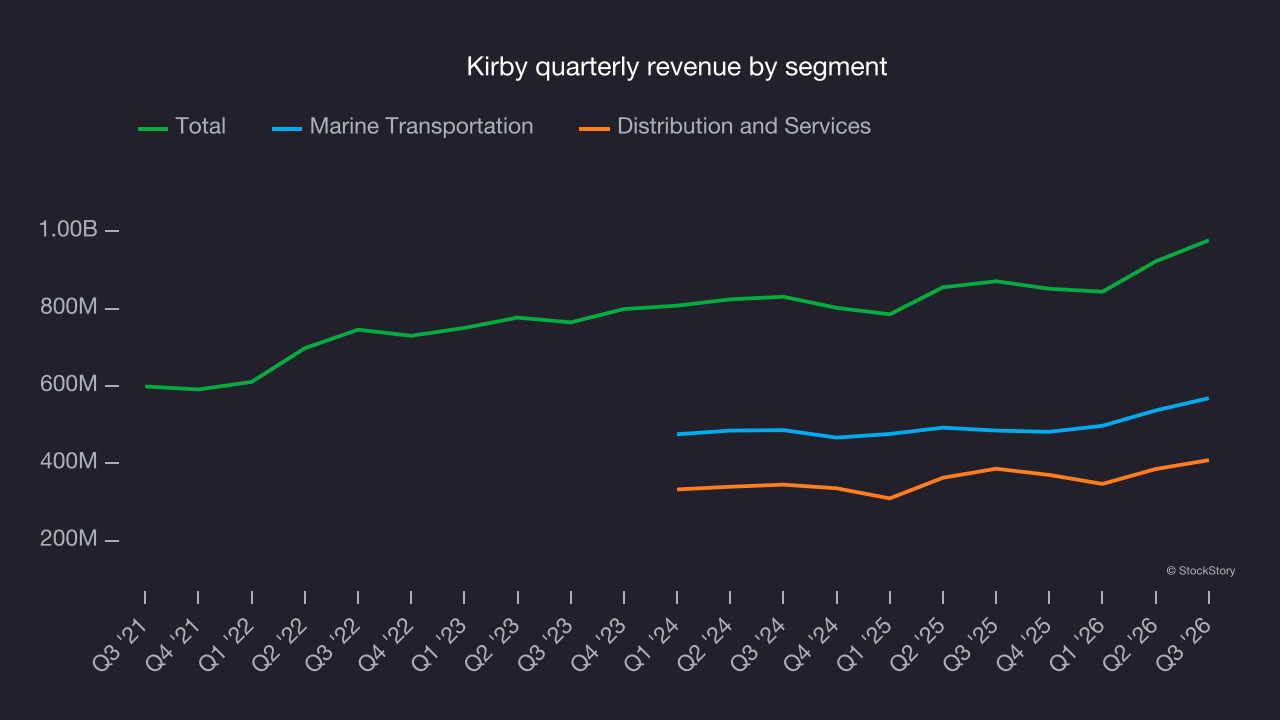
This quarter, Kirby reported year-on-year revenue growth of 12.2%, and its $977.2 million of revenue exceeded Wall Street’s consensus estimates by 4.2%.
Looking ahead, sell-side analysts expect revenue to grow 7% over the next 12 months, according to S&P. While this projection implies its newer products and services will improve revenue performance, it is still below the sector average. Still, the company is performing well on other measures of financial health.
Operating margin
Kirby has managed its cost base well over the last five years. It demonstrated solid profitability for an industrials business, producing an average operating margin of 11.6%.
Analyzing the trend in its profitability, Kirby’s operating margin rose by 7.9 percentage points over the last five years, as its revenue growth provided operating leverage. Its expansion shows it’s one of the better marine transportation companies as most peers saw their margins decline.
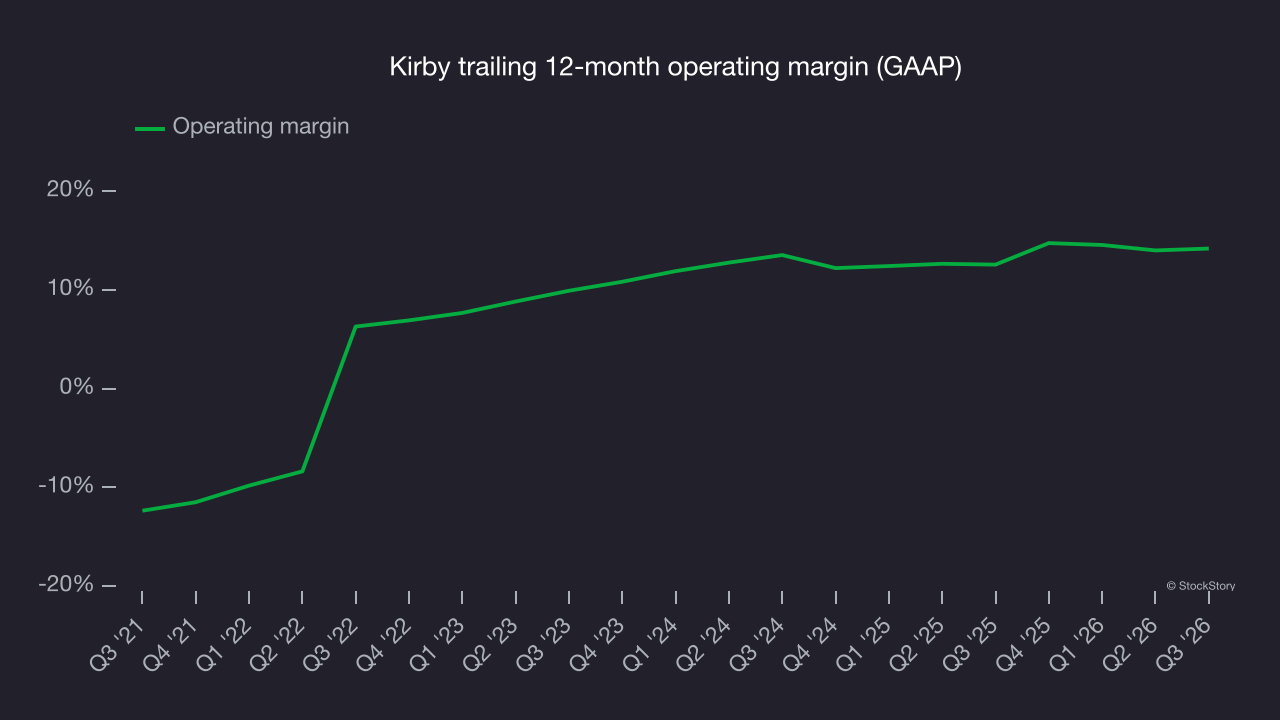
In Q3, Kirby generated an operating margin of 15.4%, in line with the same quarter last year. This indicates the company’s cost structure has recently been stable.
Earnings per share
Revenue trends explain a company’s historical growth, but the long-term change in earnings per share (EPS) points to the profitability of that growth – for example, a company could inflate its revenue through excessive spending on advertising and promotions.
Kirby’s full-year EPS flipped from negative to positive over the last five years. This is a good sign and shows it’s at an inflection point.
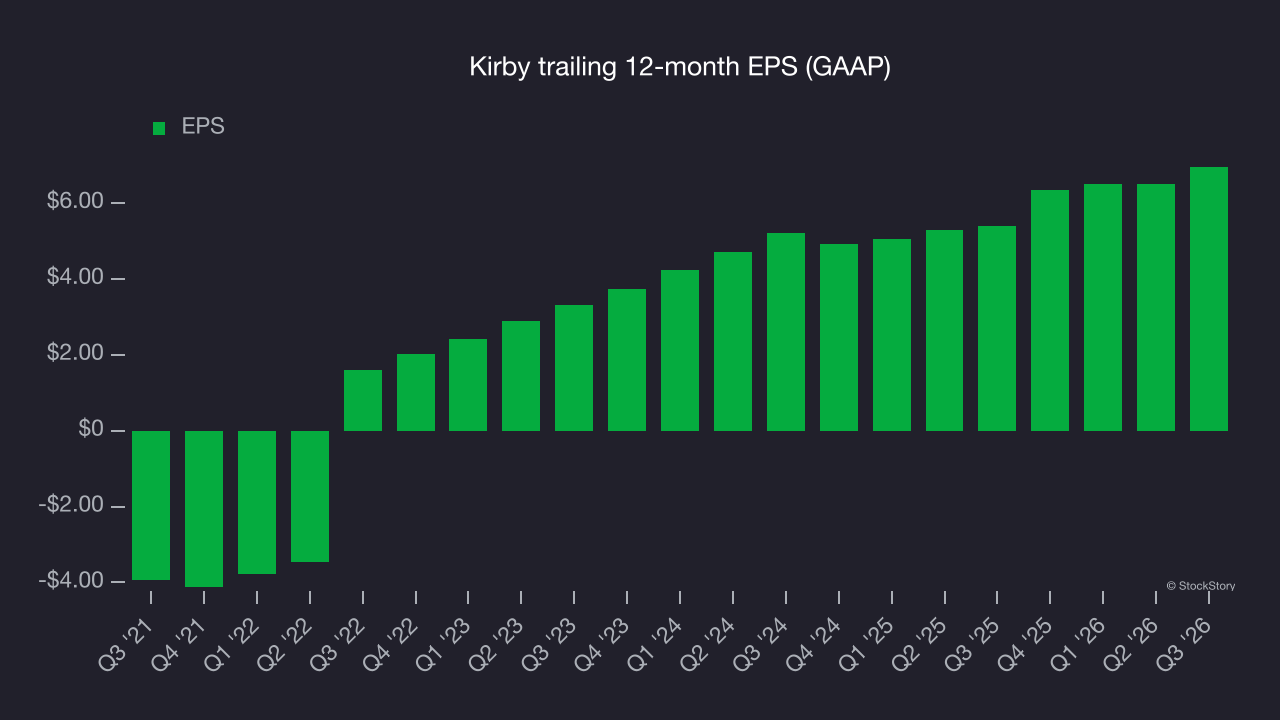
As with revenue, examining EPS over a shorter period can reveal a change in the business.
Kirby’s EPS grew at a strong 15.5% compounded annual growth rate over the last two years, higher than its 5% annualized revenue growth. This tells us the company became more profitable on a per-share basis as it expanded.
We can take a deeper look into Kirby’s earnings to better understand the drivers of its performance. A two-year view shows that Kirby has repurchased its stock, shrinking its share count by 8.9%. This tells us its EPS outperformed its revenue not because of increased operational efficiency but financial engineering, as buybacks boost per share earnings. 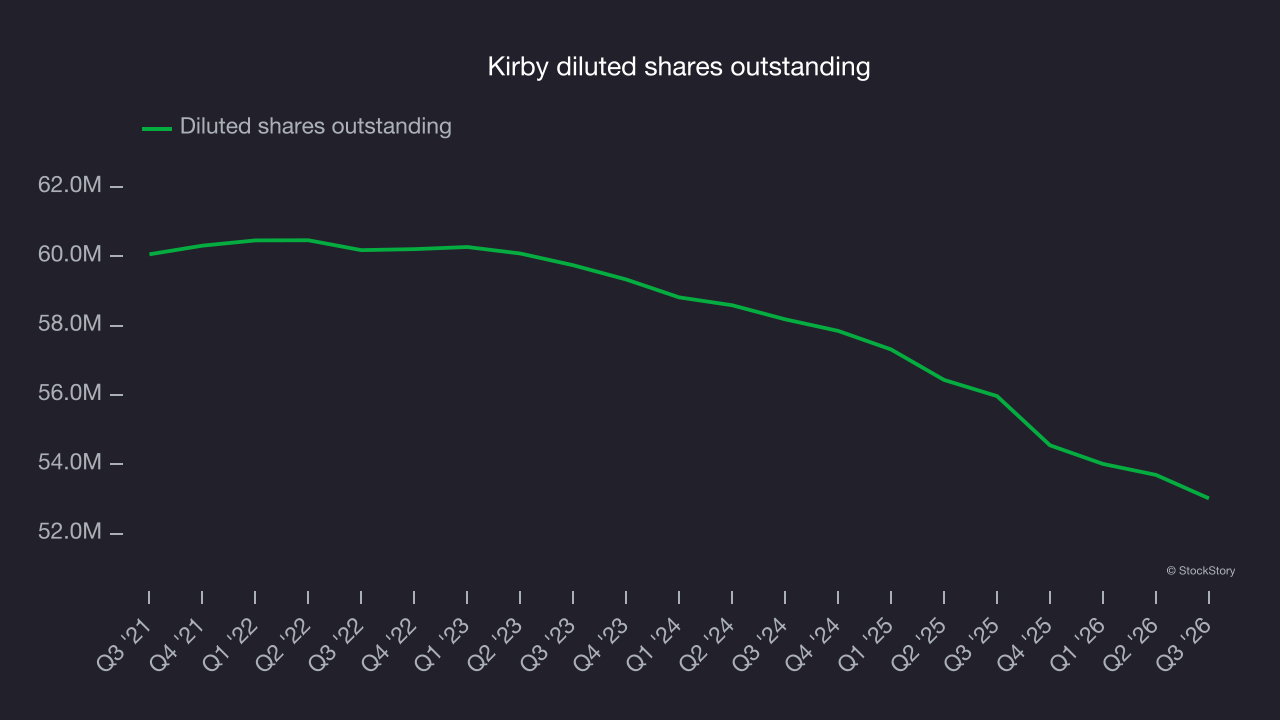
In Q3, Kirby reported EPS of $2.09, up from $1.65 in the same quarter last year. This result beat analysts’ consensus estimates by 6.8%. Over the next 12 months, Wall Street expects Kirby’s full-year EPS to grow 14.5% from $6.95 to $7.95, according to S&P.
Key takeaways from Kirby’s Q3 results
Kirby delivered a solid quarter, with revenue well above analysts’ consensus estimates and EBITDA also topping Wall Street’s estimates. Shares remained flat at $137.06 immediately after the report.
When considering an investment in Kirby, it’s important to assess its valuation, business quality and latest quarterly results. Read the full research report here (it’s free).