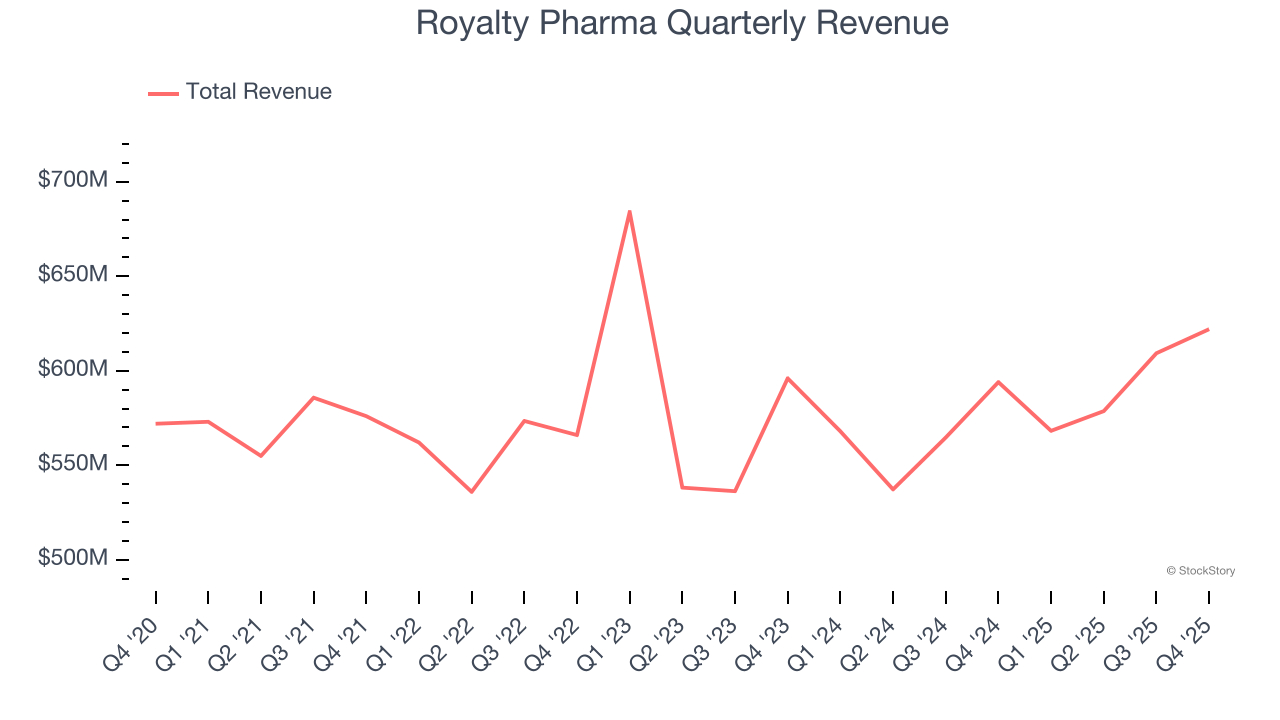
Healthcare royalties company Royalty Pharma (NASDAQ: RPRX) fell short of the market’s revenue expectations in Q4 CY2025 as sales rose 4.7% year on year to $622 million. Its GAAP profit of $0.64 per share was 57.3% below analysts’ consensus estimates.
Is now the time to buy Royalty Pharma? Find out by accessing our full research report, it’s free.
Royalty Pharma (RPRX) Q4 CY2025 Highlights:
- Revenue: $622 million vs analyst estimates of $753.9 million (4.7% year-on-year growth, 17.5% miss)
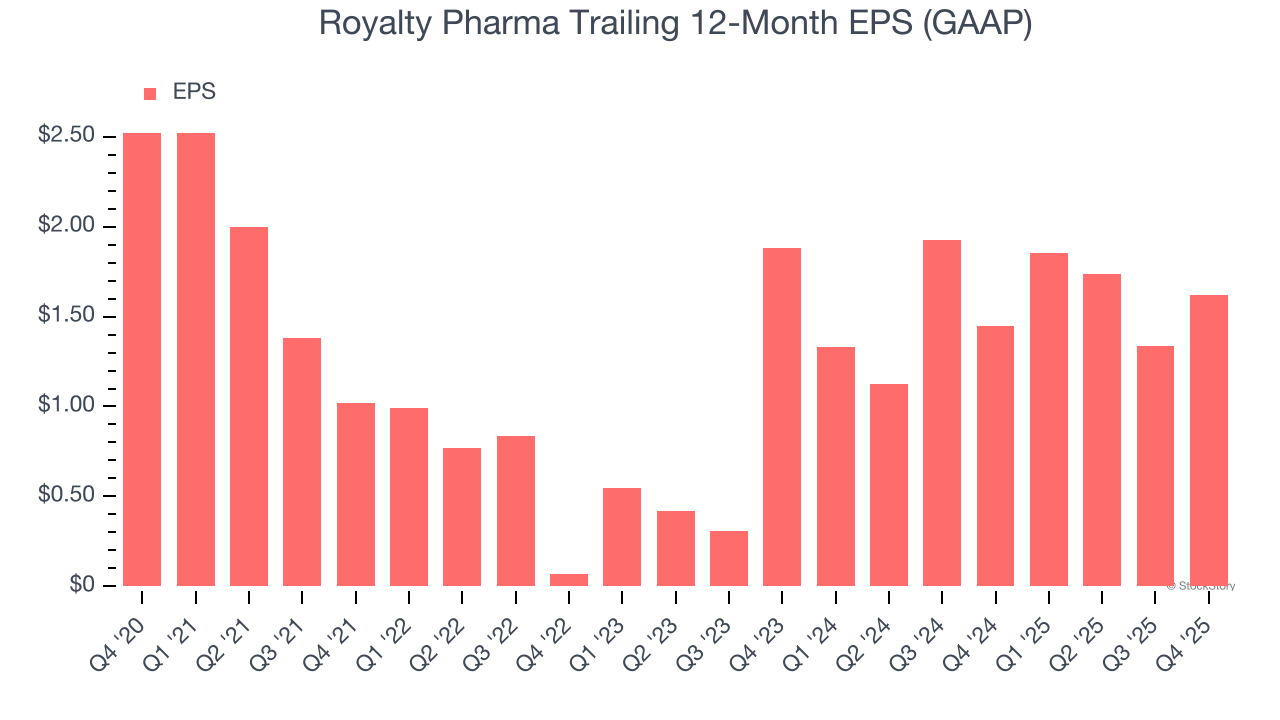
- EPS (GAAP): $0.64 vs analyst expectations of $1.50 (57.3% miss)
- Operating Margin: 62.4%, up from 60.9% in the same quarter last year
- Free Cash Flow Margin: 133%, up from 37.4% in the same quarter last year
- Market Capitalization: $18.89 billion
“We had one of the most remarkable years in Royalty Pharma’s history in 2025,” said Pablo Legorreta, Royalty Pharma’s Chief Executive Officer and Chairman of the Board.
Company Overview
Pioneering a unique business model in the pharmaceutical industry since 1996, Royalty Pharma (NASDAQ: RPRX) acquires rights to receive portions of sales from successful biopharmaceutical products, providing funding to drug developers without conducting research itself.
Revenue Growth
Examining a company’s long-term performance can provide clues about its quality. Any business can have short-term success, but a top-tier one grows for years. Regrettably, Royalty Pharma’s sales grew at a tepid 2.3% compounded annual growth rate over the last five years. This fell short of our benchmarks and is a rough starting point for our analysis.
Long-term growth is the most important, but within healthcare, a half-decade historical view may miss new innovations or demand cycles. Royalty Pharma’s recent performance shows its demand has slowed as its revenue was flat over the last two years. 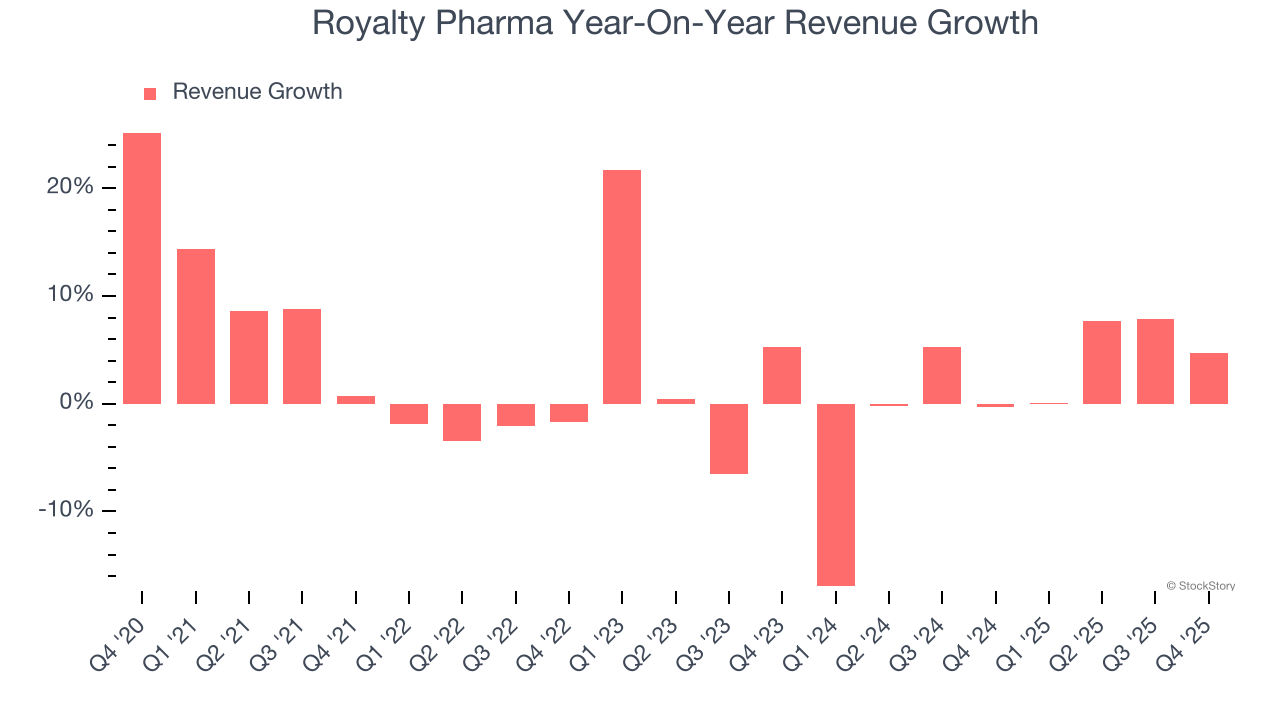
Royalty Pharma also breaks out the revenue for its most important segment, Portfolio Receipts. Over the last two years, Royalty Pharma’s Portfolio Receipts revenue averaged 11.5% year-on-year growth. This segment has outperformed its total sales during the same period, lifting the company’s performance. 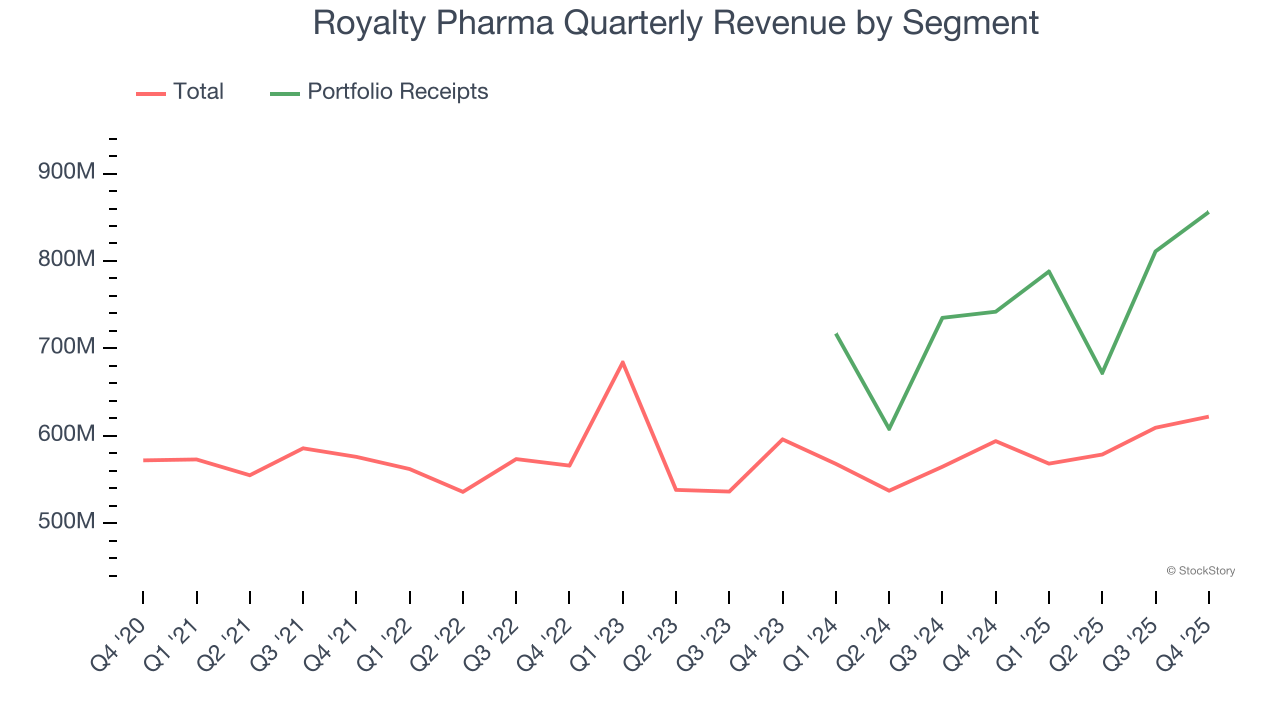
This quarter, Royalty Pharma’s revenue grew by 4.7% year on year to $622 million, falling short of Wall Street’s estimates.
Looking ahead, sell-side analysts expect revenue to grow 13.9% over the next 12 months, an improvement versus the last two years. This projection is admirable and indicates its newer products and services will fuel better top-line performance.
While Wall Street chases Nvidia at all-time highs, an under-the-radar semiconductor supplier is dominating a critical AI component these giants can’t build without. Click here to access our free report one of our favorites growth stories.
Operating Margin
Operating margin is a key measure of profitability. Think of it as net income - the bottom line - excluding the impact of taxes and interest on debt, which are less connected to business fundamentals.
Royalty Pharma has been a well-oiled machine over the last five years. It demonstrated elite profitability for a healthcare business, boasting an average operating margin of 52.8%.
Analyzing the trend in its profitability, Royalty Pharma’s operating margin rose by 3.1 percentage points over the last five years, as its sales growth gave it operating leverage. The company’s two-year trajectory shows its performance was mostly driven by its recent improvements.
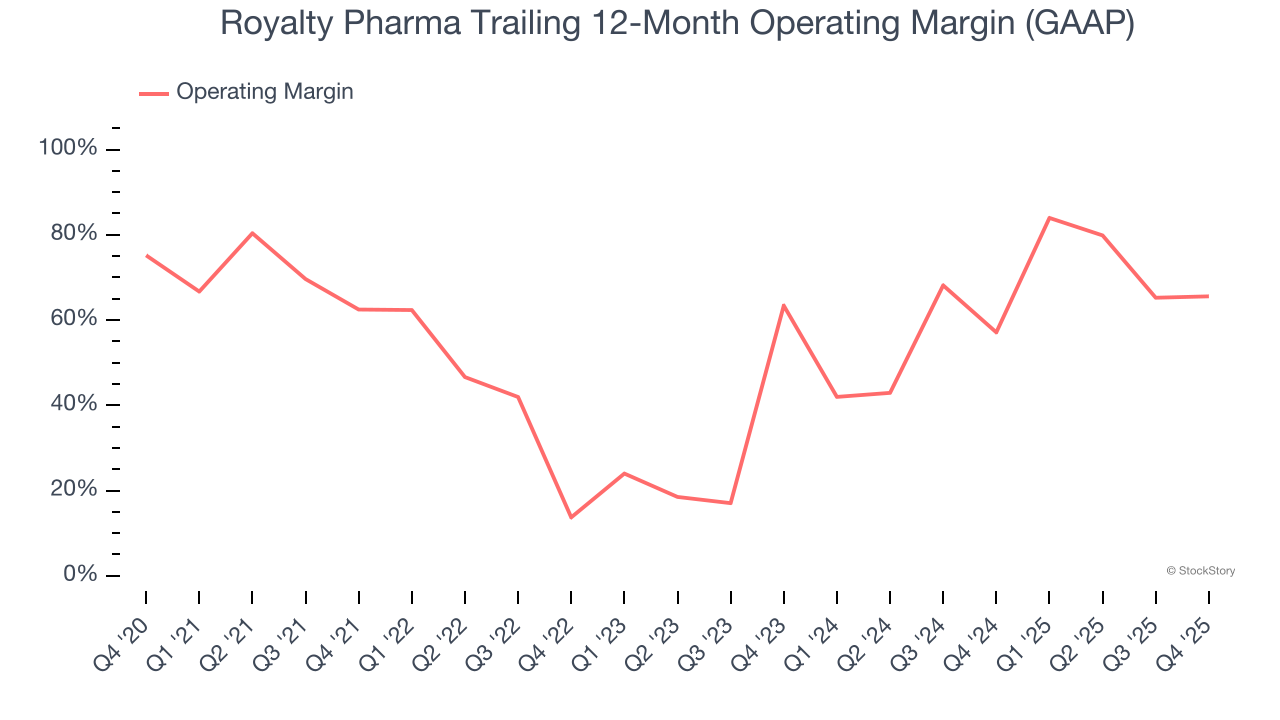
This quarter, Royalty Pharma generated an operating margin profit margin of 62.4%, up 1.4 percentage points year on year. This increase was a welcome development and shows it was more efficient.
Earnings Per Share
Revenue trends explain a company’s historical growth, but the long-term change in earnings per share (EPS) points to the profitability of that growth – for example, a company could inflate its sales through excessive spending on advertising and promotions.
Sadly for Royalty Pharma, its EPS declined by 8.5% annually over the last five years while its revenue grew by 2.3%. However, its operating margin actually improved during this time, telling us that non-fundamental factors such as interest expenses and taxes affected its ultimate earnings.
We can take a deeper look into Royalty Pharma’s earnings to better understand the drivers of its performance. A five-year view shows Royalty Pharma has diluted its shareholders, growing its share count by 39.5%. This dilution overshadowed its increased operational efficiency and has led to lower per share earnings. Taxes and interest expenses can also affect EPS but don’t tell us as much about a company’s fundamentals. 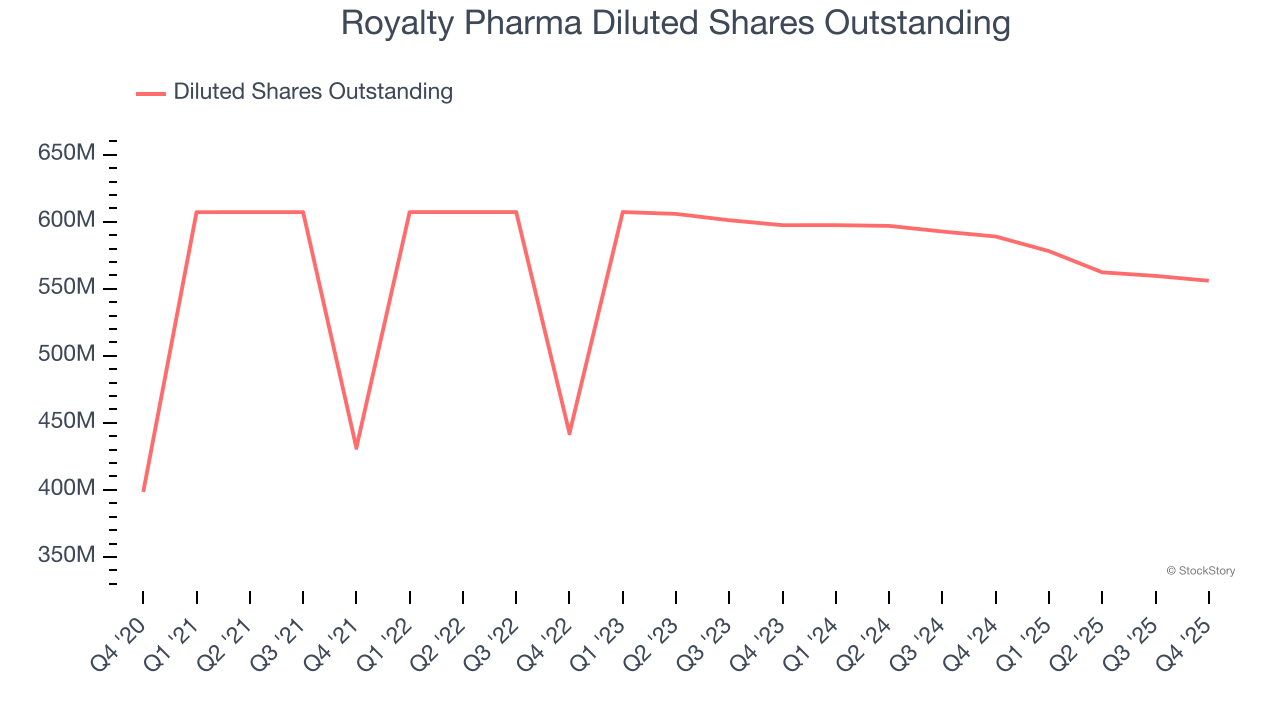
In Q4, Royalty Pharma reported EPS of $0.64, up from $0.35 in the same quarter last year. Despite growing year on year, this print missed analysts’ estimates. We also like to analyze expected EPS growth based on Wall Street analysts’ consensus projections, but there is insufficient data.
Key Takeaways from Royalty Pharma’s Q4 Results
We struggled to find many positives in these results. Its revenue missed and its EPS fell short of Wall Street’s estimates. Overall, this was a weaker quarter. The stock remained flat at $44.22 immediately after reporting.
Royalty Pharma didn’t show it’s best hand this quarter, but does that create an opportunity to buy the stock right now? The latest quarter does matter, but not nearly as much as longer-term fundamentals and valuation, when deciding if the stock is a buy. We cover that in our actionable full research report which you can read here (it’s free).