
Welding and cutting equipment manufacturer ESAB (NYSE: ESAB) reported revenue ahead of Wall Street’s expectations in Q1 CY2026, with sales up 9.9% year on year to $745.6 million. Its non-GAAP profit of $1.29 per share was 3.4% below analysts’ consensus estimates.
Is now the time to buy ESAB? Find out by accessing our full research report, it’s free.
ESAB (ESAB) Q1 CY2026 Highlights:
- Revenue: $745.6 million vs analyst estimates of $728.9 million (9.9% year-on-year growth, 2.3% beat)
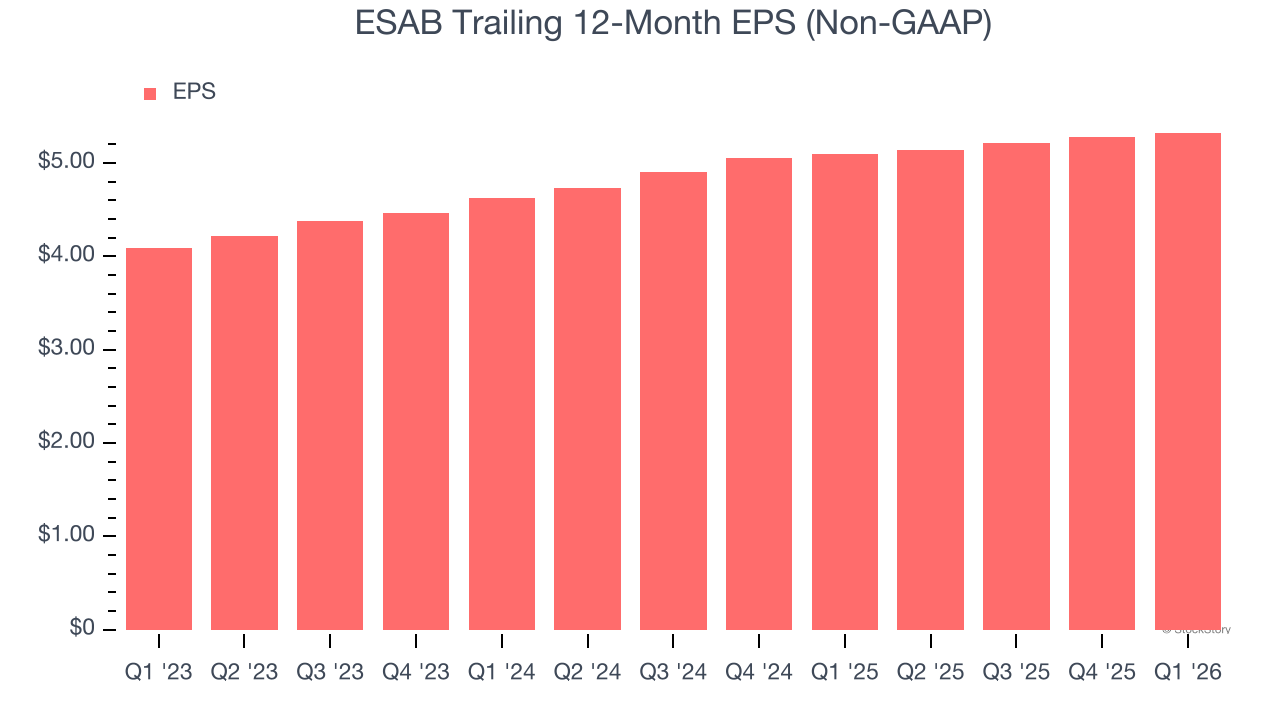
- Adjusted EPS: $1.29 vs analyst expectations of $1.34 (3.4% miss)
- Adjusted EBITDA: $56 million vs analyst estimates of $136.8 million (7.5% margin, 59.1% miss)
- Operating Margin: 12.1%, down from 16.2% in the same quarter last year
- Free Cash Flow Margin: 4.5%, similar to the same quarter last year
- Market Capitalization: $6.18 billion
Company Overview
Having played a significant role in the construction of the iconic Sydney Opera House, ESAB (NYSE: ESAB) manufactures and sells welding and cutting equipment for numerous industries.
Revenue Growth
A company’s long-term sales performance is one signal of its overall quality. Even a bad business can shine for one or two quarters, but a top-tier one grows for years. Over the last four years, ESAB grew its sales at a sluggish 3.8% compounded annual growth rate. This fell short of our benchmark for the industrials sector and is a poor baseline for our analysis.
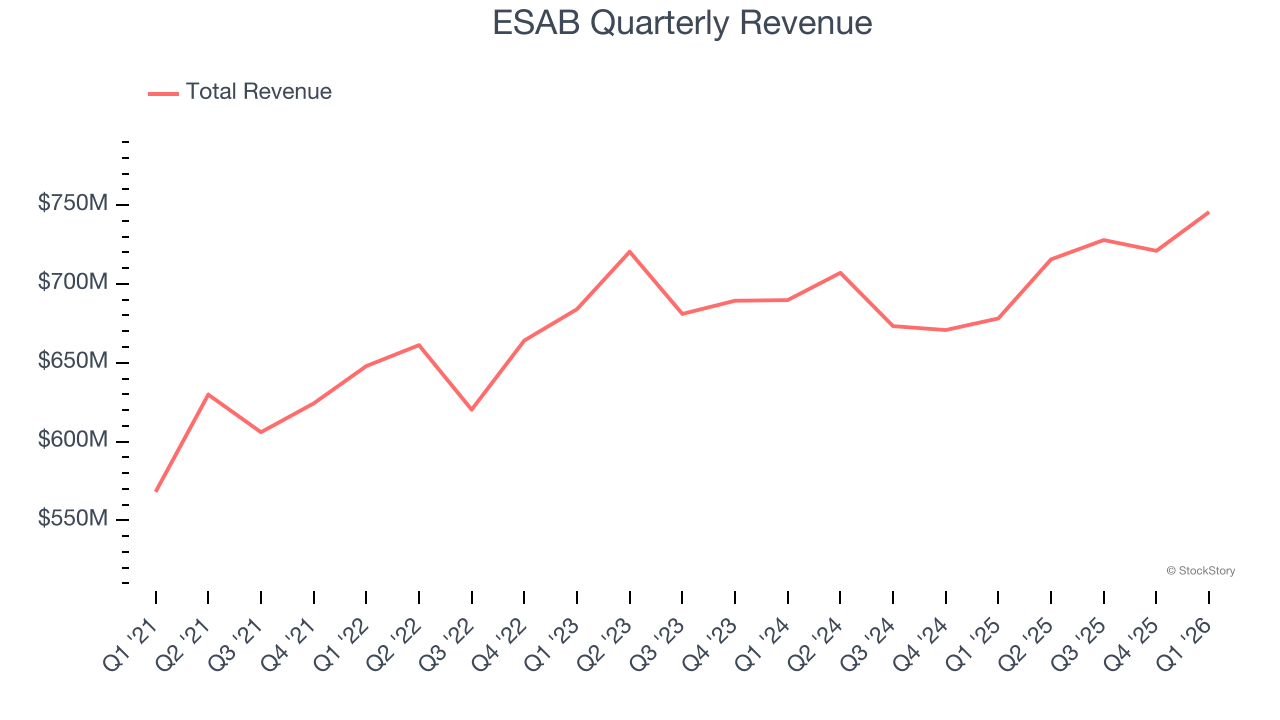
Long-term growth is the most important, but within industrials, a stretched historical view may miss new industry trends or demand cycles. ESAB’s recent performance shows its demand has slowed as its annualized revenue growth of 2.3% over the last two years was below its four-year trend. We’re wary when companies in the sector see decelerations in revenue growth, as it could signal changing consumer tastes aided by low switching costs. 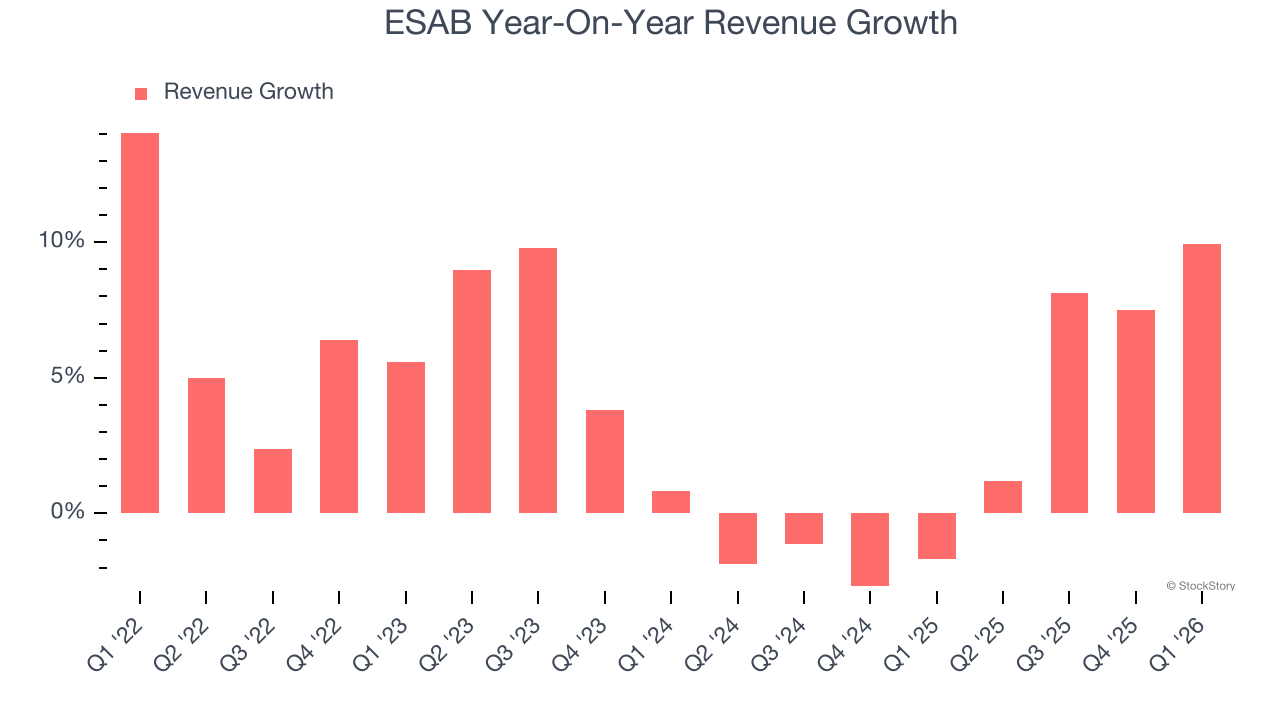
This quarter, ESAB reported year-on-year revenue growth of 9.9%, and its $745.6 million of revenue exceeded Wall Street’s estimates by 2.3%.
Looking ahead, sell-side analysts expect revenue to grow 6% over the next 12 months. Although this projection indicates its newer products and services will fuel better top-line performance, it is still below the sector average.
ONE MORE THING: The $21 AI Application Stock Wall Street Forgot. While Wall Street obsesses over who’s building AI, one company is already using it to print money. And nobody’s paying attention.
AI chip stocks trade at ridiculous valuations. This company processes a trillion consumer signals monthly using AI and trades at a third of the price. The gap won’t last. The institutions will figure it out. You need to see this first. Read the FREE Report Before They Notice.
Operating Margin
Operating margin is an important measure of profitability as it shows the portion of revenue left after accounting for all core expenses – everything from the cost of goods sold to advertising and wages. It’s also useful for comparing profitability across companies with different levels of debt and tax rates because it excludes interest and taxes.
ESAB’s operating margin has generally stayed the same over the last 12 months, averaging 14.1% over the last five years. This profitability was top-notch for an industrials business, showing it’s an well-run company with an efficient cost structure. This result isn’t surprising as its high gross margin gives it a favorable starting point.
Analyzing the trend in its profitability, ESAB’s operating margin might fluctuated slightly but has generally stayed the same over the last five years. This raises questions about the company’s expense base because its revenue growth should have given it leverage on its fixed costs, resulting in better economies of scale and profitability.
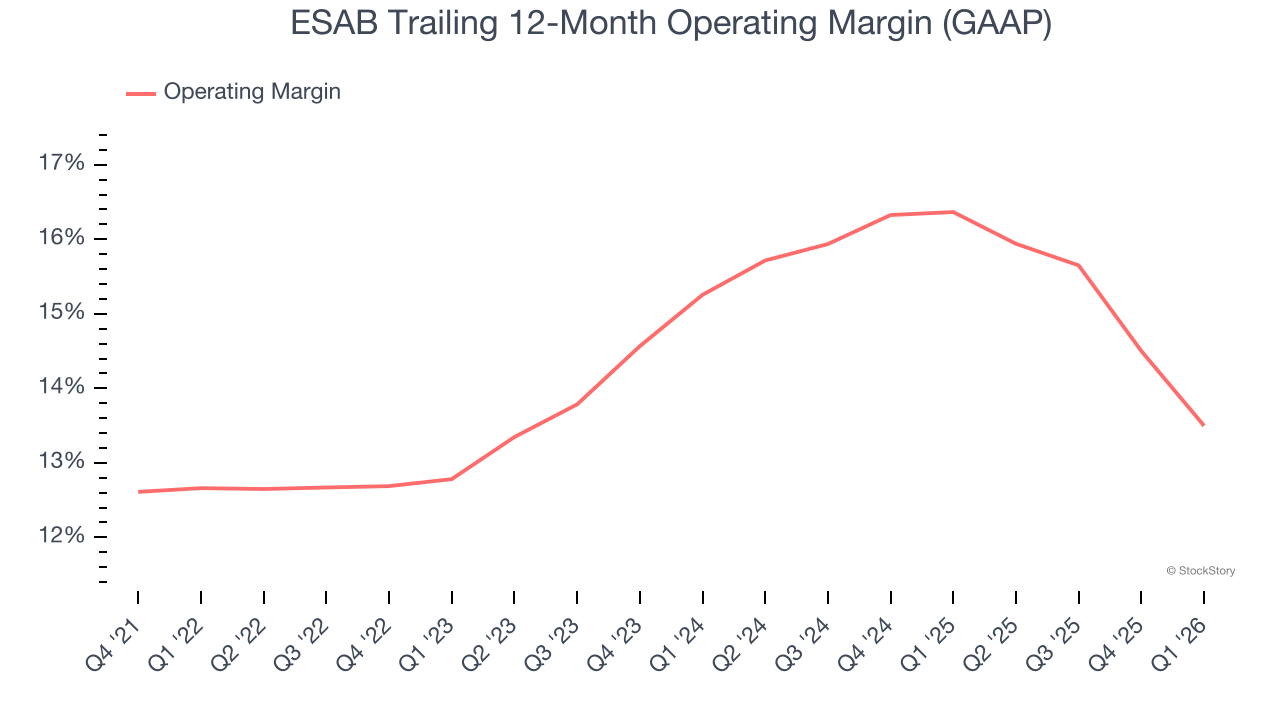
This quarter, ESAB generated an operating margin profit margin of 12.1%, down 4.1 percentage points year on year. Since ESAB’s operating margin decreased more than its gross margin, we can assume it was less efficient because expenses such as marketing, R&D, and administrative overhead increased.
Earnings Per Share
We track the long-term change in earnings per share (EPS) for the same reason as long-term revenue growth. Compared to revenue, however, EPS highlights whether a company’s growth is profitable.
ESAB’s full-year EPS grew at a solid 10.2% compounded annual growth rate over the last three years, better than the broader industrials sector.
Like with revenue, we analyze EPS over a shorter period to see if we are missing a change in the business.
For ESAB, its two-year annual EPS growth of 7.3% was lower than its three-year trend. We hope its growth can accelerate in the future.
In Q1, ESAB reported adjusted EPS of $1.29, up from $1.25 in the same quarter last year. Despite growing year on year, this print missed analysts’ estimates, but we care more about long-term adjusted EPS growth than short-term movements. Over the next 12 months, Wall Street expects ESAB’s full-year EPS of $5.32 to grow 12.7%.
Key Takeaways from ESAB’s Q1 Results
We enjoyed seeing ESAB beat analysts’ revenue expectations this quarter. On the other hand, its adjusted operating income missed and its EBITDA fell short of Wall Street’s estimates. Overall, this was a weaker quarter. The stock traded down 3% to $98.53 immediately after reporting.
ESAB didn’t show it’s best hand this quarter, but does that create an opportunity to buy the stock right now? If you’re making that decision, you should consider the bigger picture of valuation, business qualities, as well as the latest earnings. We cover that in our actionable full research report which you can read here (it’s free).


