
Home and security products company Fortune Brands (NYSE: FBIN) met Wall Street’s revenue expectations in Q1 CY2026, but sales fell by 2.1% year on year to $1.01 billion. Its non-GAAP profit of $0.53 per share was in line with analysts’ consensus estimates.
Is now the time to buy Fortune Brands? Find out by accessing our full research report, it’s free.
Fortune Brands (FBIN) Q1 CY2026 Highlights:
- Revenue: $1.01 billion vs analyst estimates of $1.01 billion (2.1% year-on-year decline, in line)
- Adjusted EPS: $0.53 vs analyst estimates of $0.53 (in line)
- Adjusted EBITDA: $154.4 million vs analyst estimates of $157.2 million (15.3% margin, 1.8% miss)
- Operating Margin: 6%, down from 9.4% in the same quarter last year
- Free Cash Flow was -$139.5 million compared to -$112.6 million in the same quarter last year
- Market Capitalization: $4.79 billion
Company Overview
Targeting a wide customer base of residential and commercial customers, Fortune Brands (NYSE: FBIN) makes plumbing, security, and outdoor living products.
Revenue Growth
A company’s long-term sales performance is one signal of its overall quality. Even a bad business can shine for one or two quarters, but a top-tier one grows for years. Unfortunately, Fortune Brands’s 2.5% annualized revenue growth over the last five years was sluggish. This was below our standards and is a tough starting point for our analysis.
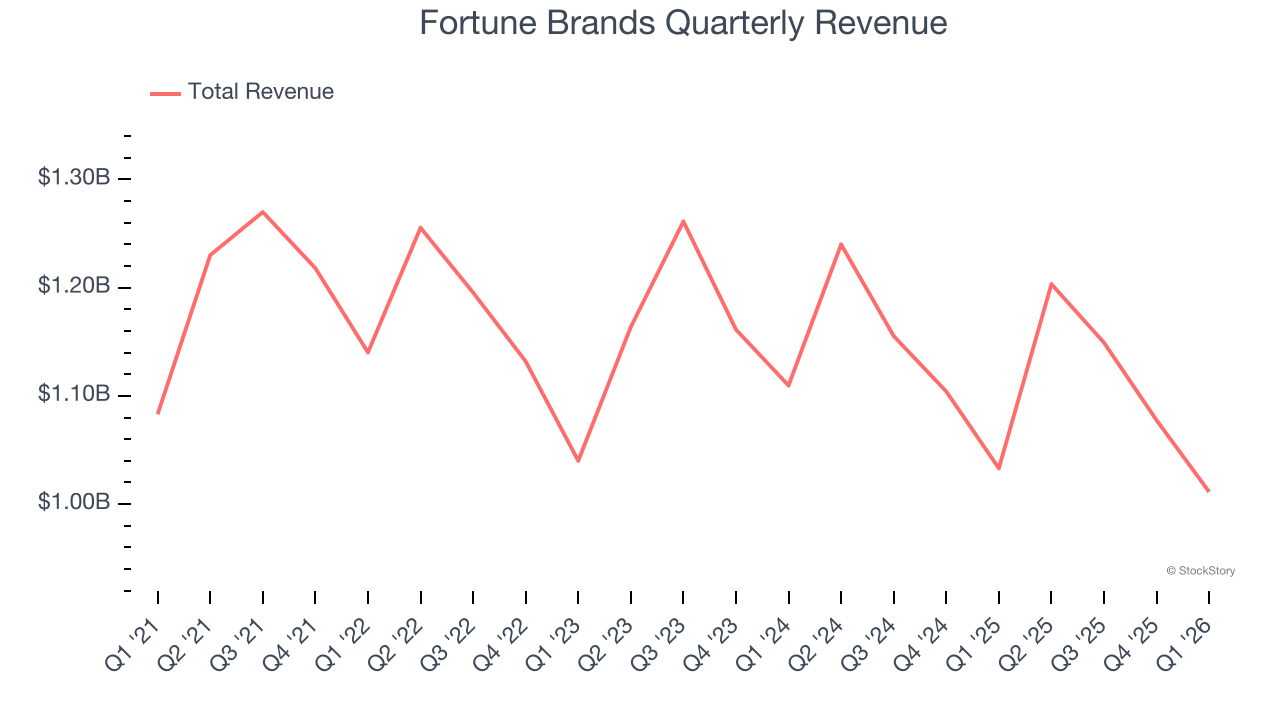
Long-term growth is the most important, but within industrials, a half-decade historical view may miss new industry trends or demand cycles. Fortune Brands’s performance shows it grew in the past but relinquished its gains over the last two years, as its revenue fell by 2.7% annually. 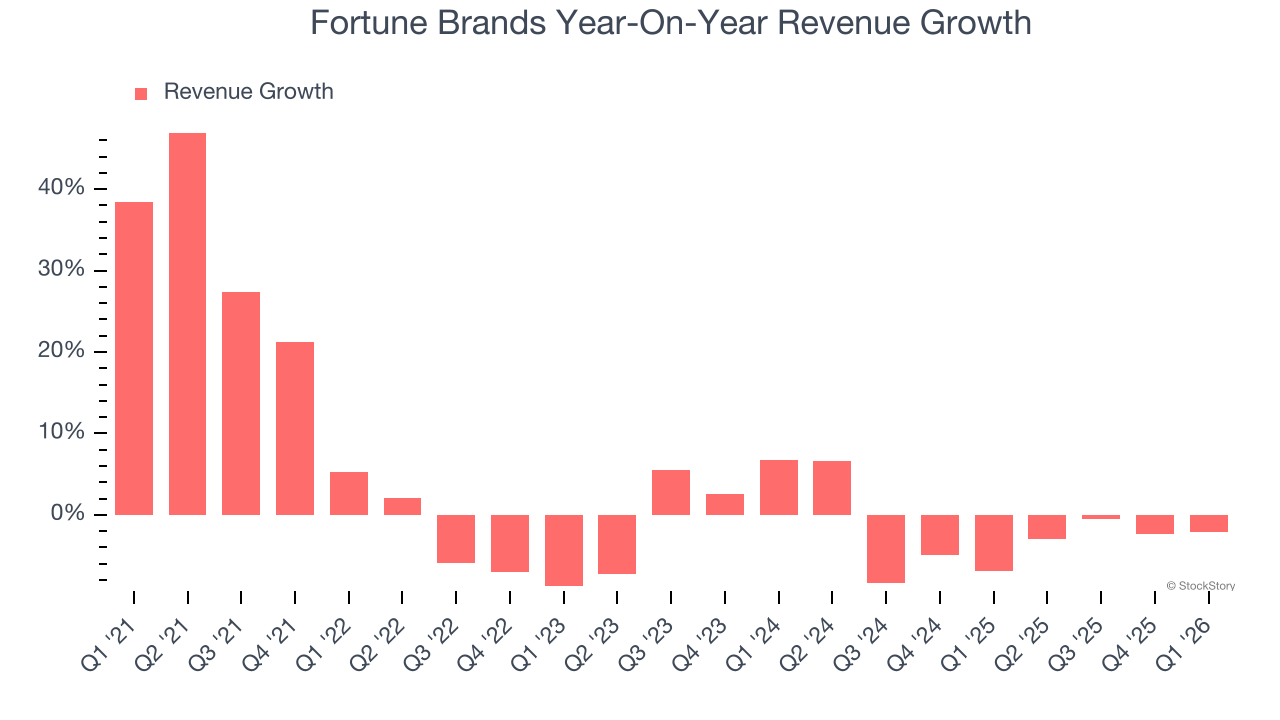
This quarter, Fortune Brands reported a rather uninspiring 2.1% year-on-year revenue decline to $1.01 billion of revenue, in line with Wall Street’s estimates.
Looking ahead, sell-side analysts expect revenue to grow 1.3% over the next 12 months. Although this projection suggests its newer products and services will fuel better top-line performance, it is still below average for the sector.
ONE MORE THING: The $21 AI Application Stock Wall Street Forgot. While Wall Street obsesses over who’s building AI, one company is already using it to print money. And nobody’s paying attention.
AI chip stocks trade at ridiculous valuations. This company processes a trillion consumer signals monthly using AI and trades at a third of the price. The gap won’t last. The institutions will figure it out. You need to see this first. Read the FREE Report Before They Notice.
Operating Margin
Fortune Brands has been an efficient company over the last five years. It was one of the more profitable businesses in the industrials sector, boasting an average operating margin of 15%. This result isn’t surprising as its high gross margin gives it a favorable starting point.
Analyzing the trend in its profitability, Fortune Brands’s operating margin decreased by 8.9 percentage points over the last five years. This raises questions about the company’s expense base because its revenue growth should have given it leverage on its fixed costs, resulting in better economies of scale and profitability.
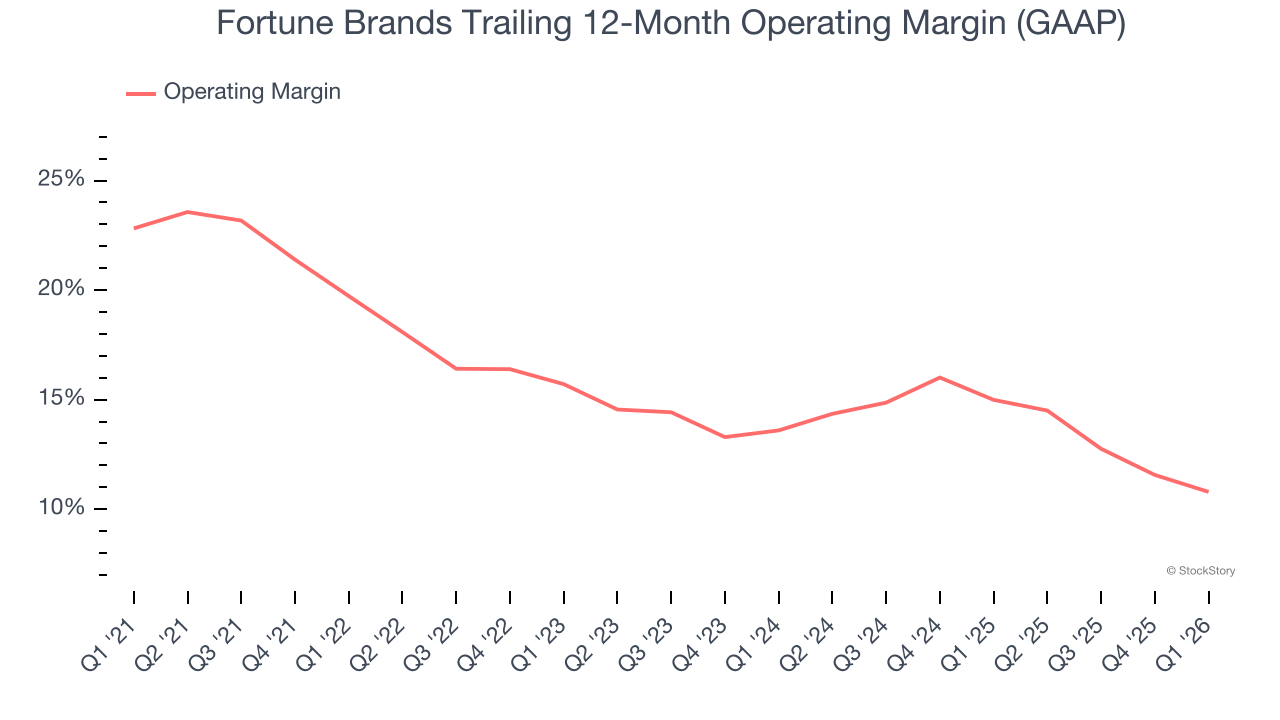
This quarter, Fortune Brands generated an operating margin profit margin of 6%, down 3.4 percentage points year on year. Since Fortune Brands’s operating margin decreased more than its gross margin, we can assume it was less efficient because expenses such as marketing, R&D, and administrative overhead increased.
Earnings Per Share
We track the long-term change in earnings per share (EPS) for the same reason as long-term revenue growth. Compared to revenue, however, EPS highlights whether a company’s growth is profitable.
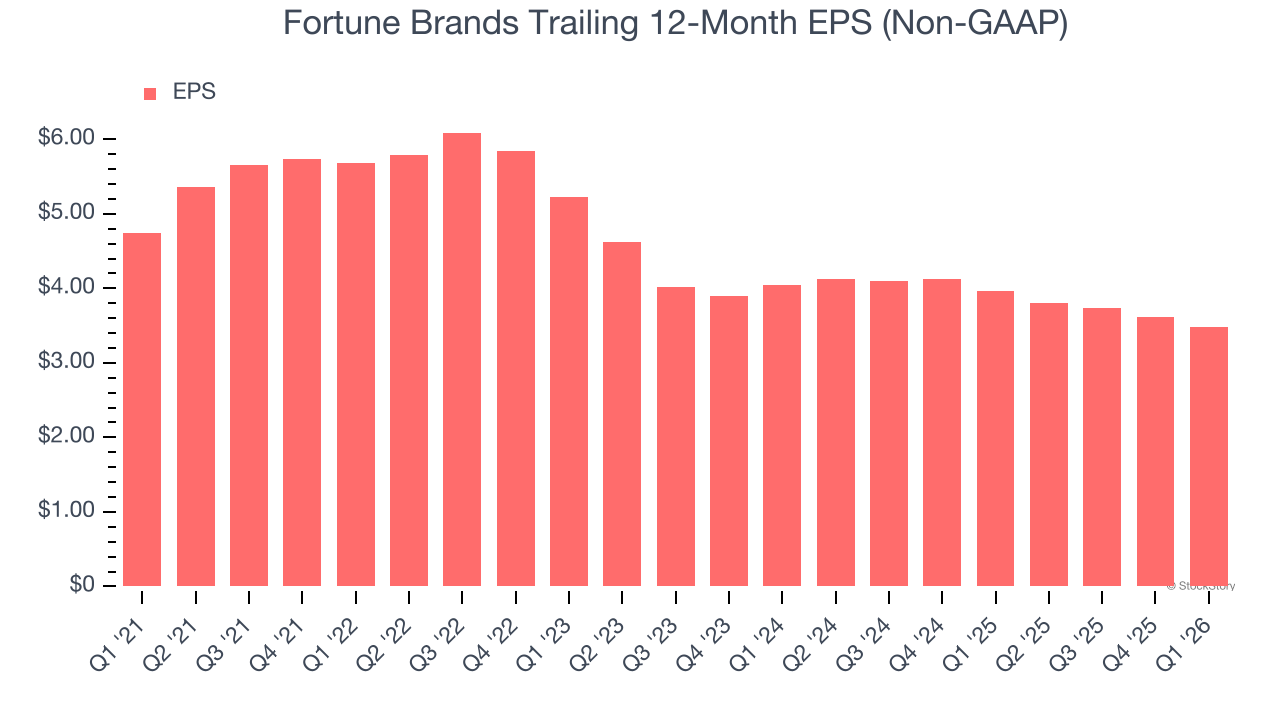
Sadly for Fortune Brands, its EPS declined by 6% annually over the last five years while its revenue grew by 2.5%. This tells us the company became less profitable on a per-share basis as it expanded due to non-fundamental factors such as interest expenses and taxes.
Diving into the nuances of Fortune Brands’s earnings can give us a better understanding of its performance. As we mentioned earlier, Fortune Brands’s operating margin declined by 8.9 percentage points over the last five years. This was the most relevant factor (aside from the revenue impact) behind its lower earnings; interest expenses and taxes can also affect EPS but don’t tell us as much about a company’s fundamentals.
Like with revenue, we analyze EPS over a more recent period because it can provide insight into an emerging theme or development for the business.
For Fortune Brands, its two-year annual EPS declines of 7.2% show it’s continued to underperform. These results were bad no matter how you slice the data.
In Q1, Fortune Brands reported adjusted EPS of $0.53, down from $0.66 in the same quarter last year. This print was close to analysts’ estimates. Over the next 12 months, Wall Street expects Fortune Brands’s full-year EPS of $3.48 to grow 1.5%.
Key Takeaways from Fortune Brands’s Q1 Results
We struggled to find many positives in these results. Its adjusted operating income missed and its EBITDA fell short of Wall Street’s estimates. Overall, this was a weaker quarter. The stock traded down 3% to $37.86 immediately following the results.
Fortune Brands’s earnings report left more to be desired. Let’s look forward to see if this quarter has created an opportunity to buy the stock. When making that decision, it’s important to consider its valuation, business qualities, as well as what has happened in the latest quarter. We cover that in our actionable full research report which you can read here (it’s free).


