
Performance marketing company QuinStreet (NASDAQ: QNST) announced better-than-expected revenue in Q1 CY2026, with sales up 28.3% year on year to $346.1 million. The company expects next quarter’s revenue to be around $360 million, close to analysts’ estimates. Its non-GAAP profit of $0.31 per share was in line with analysts’ consensus estimates.
Is now the time to buy QuinStreet? Find out by accessing our full research report, it’s free.
QuinStreet (QNST) Q1 CY2026 Highlights:
- Revenue: $346.1 million vs analyst estimates of $337.4 million (28.3% year-on-year growth, 2.6% beat)
- Adjusted EPS: $0.31 vs analyst estimates of $0.32 (in line)
- Adjusted EBITDA: $29.62 million vs analyst estimates of $28.77 million (8.6% margin, 3% beat)
- Revenue Guidance for Q2 CY2026 is $360 million at the midpoint, roughly in line with what analysts were expecting
- EBITDA guidance for Q2 CY2026 is $40 million at the midpoint, below analyst estimates of $42.48 million
- Operating Margin: 3%, up from 1.8% in the same quarter last year
- Free Cash Flow Margin: 9.8%, similar to the same quarter last year
- Market Capitalization: $742.1 million
Company Overview
Founded during the dot-com era in 1999 and specializing in high-intent consumer traffic, QuinStreet (NASDAQ: QNST) operates digital performance marketplaces that connect clients in financial and home services with consumers actively searching for their products.
Revenue Growth
A company’s long-term sales performance can indicate its overall quality. Any business can experience short-term success, but top-performing ones enjoy sustained growth for years.
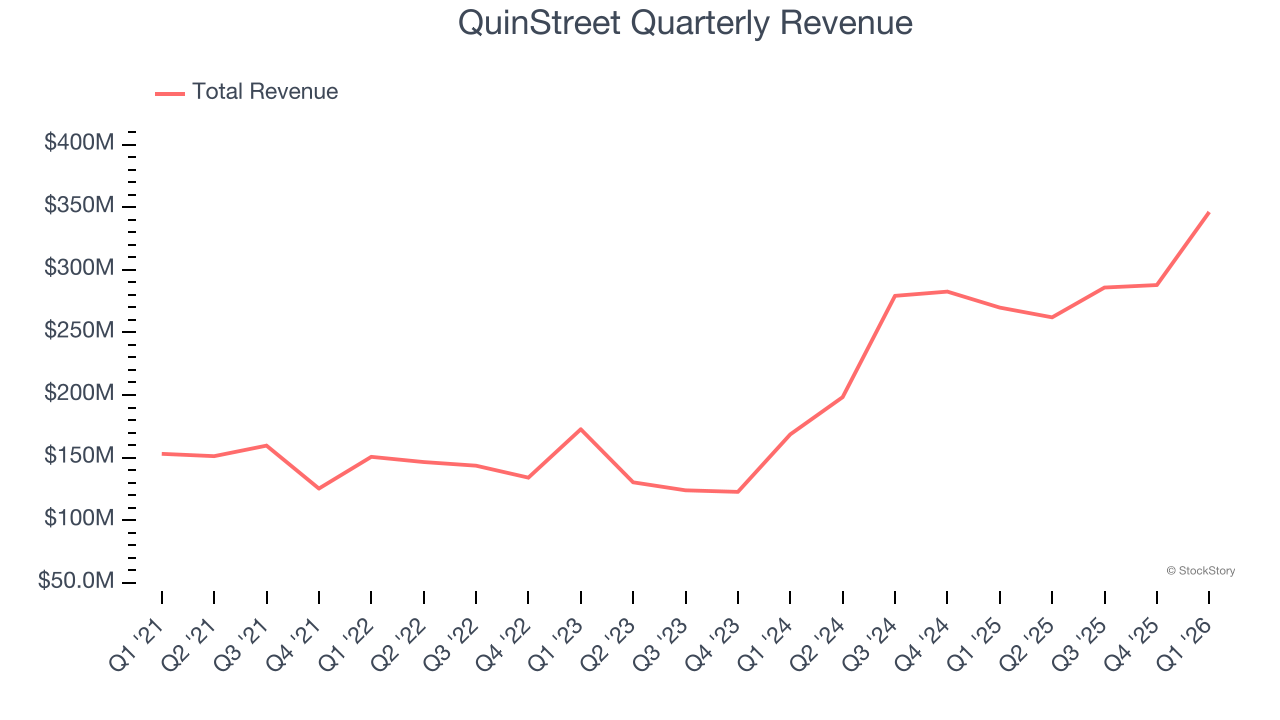
With $1.18 billion in revenue over the past 12 months, QuinStreet is a small player in the business services space, which sometimes brings disadvantages compared to larger competitors benefiting from economies of scale and numerous distribution channels. On the bright side, it can grow faster because it has more room to expand.
As you can see below, QuinStreet grew its sales at an incredible 16.8% compounded annual growth rate over the last five years. This is a great starting point for our analysis because it shows QuinStreet’s demand was higher than many business services companies.
Long-term growth is the most important, but within business services, a half-decade historical view may miss new innovations or demand cycles. QuinStreet’s annualized revenue growth of 47.2% over the last two years is above its five-year trend, suggesting its demand was strong and recently accelerated. 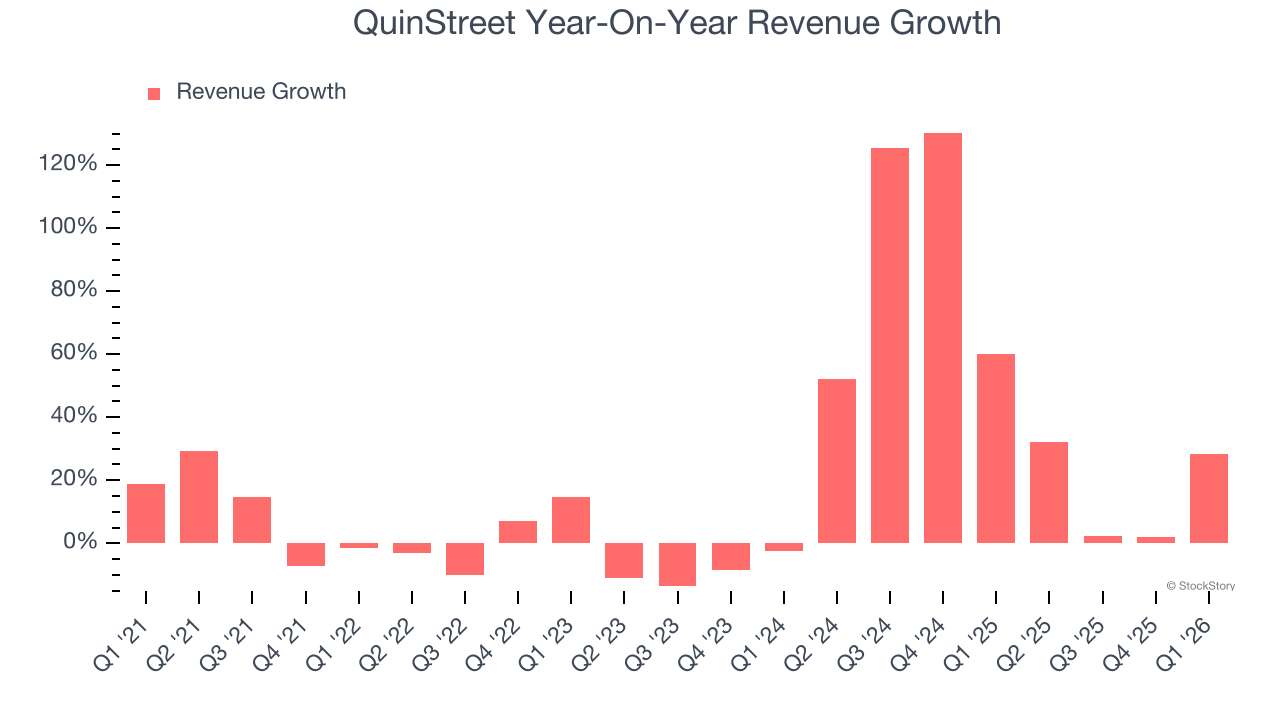
This quarter, QuinStreet reported robust year-on-year revenue growth of 28.3%, and its $346.1 million of revenue topped Wall Street estimates by 2.6%. Company management is currently guiding for a 37.4% year-on-year increase in sales next quarter.
Looking further ahead, sell-side analysts expect revenue to grow 20.5% over the next 12 months, a deceleration versus the last two years. Still, this projection is healthy and indicates the market is forecasting success for its products and services.
ONE MORE THING: 3 Hidden Platforms Growing 3X Faster than Amazon, Google, and PayPal. Amazon, Google, and Meta all followed the same playbook: Dominate an ignored market. Build an unbeatable moat. Scale until you’re unstoppable.
These three platforms are running that exact playbook right now. The early investors in Amazon made fortunes. The early investors in these could do the same. Get All 3 Stocks Here for FREE.
Adjusted Operating Margin
QuinStreet was roughly breakeven when averaging the last five years of quarterly operating profits, one of the worst outcomes in the business services sector.
On the plus side, QuinStreet’s adjusted operating margin rose by 2 percentage points over the last five years, as its sales growth gave it operating leverage.
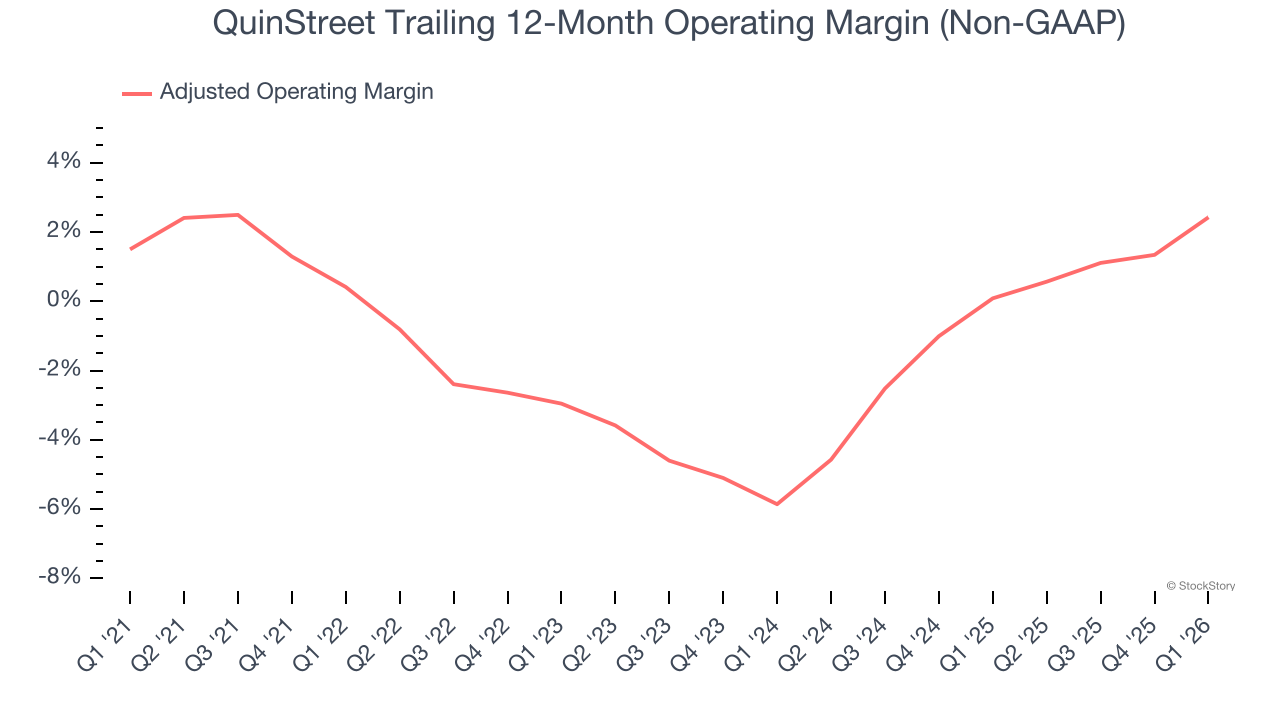
This quarter, QuinStreet generated an adjusted operating margin profit margin of 5.4%, up 3.6 percentage points year on year. This increase was a welcome development and shows it was more efficient.
Earnings Per Share
We track the long-term change in earnings per share (EPS) for the same reason as long-term revenue growth. Compared to revenue, however, EPS highlights whether a company’s growth is profitable.
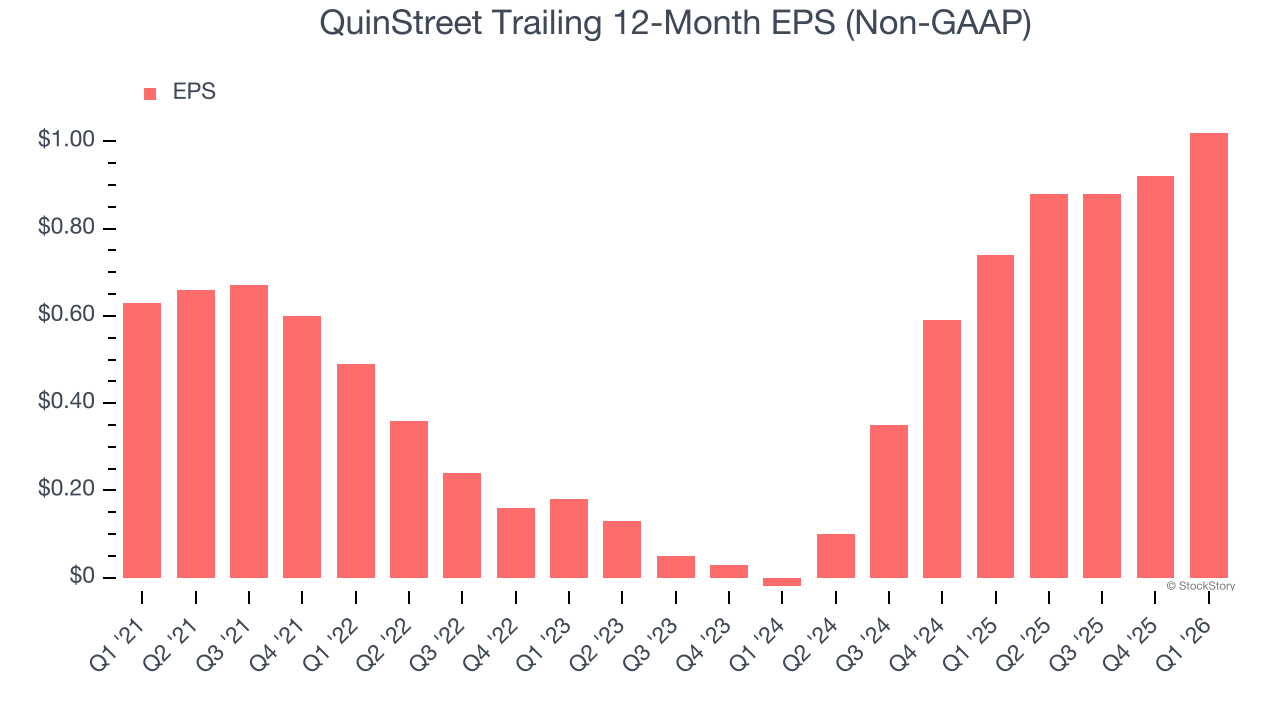
QuinStreet’s EPS grew at a solid 10.1% compounded annual growth rate over the last five years. Despite its adjusted operating margin improvement during that time, this performance was lower than its 16.8% annualized revenue growth, telling us that non-fundamental factors such as interest and taxes affected its ultimate earnings.
Diving into the nuances of QuinStreet’s earnings can give us a better understanding of its performance. A five-year view shows QuinStreet has diluted its shareholders, growing its share count by 4.3%. This dilution overshadowed its increased operational efficiency and has led to lower per share earnings. Taxes and interest expenses can also affect EPS but don’t tell us as much about a company’s fundamentals. 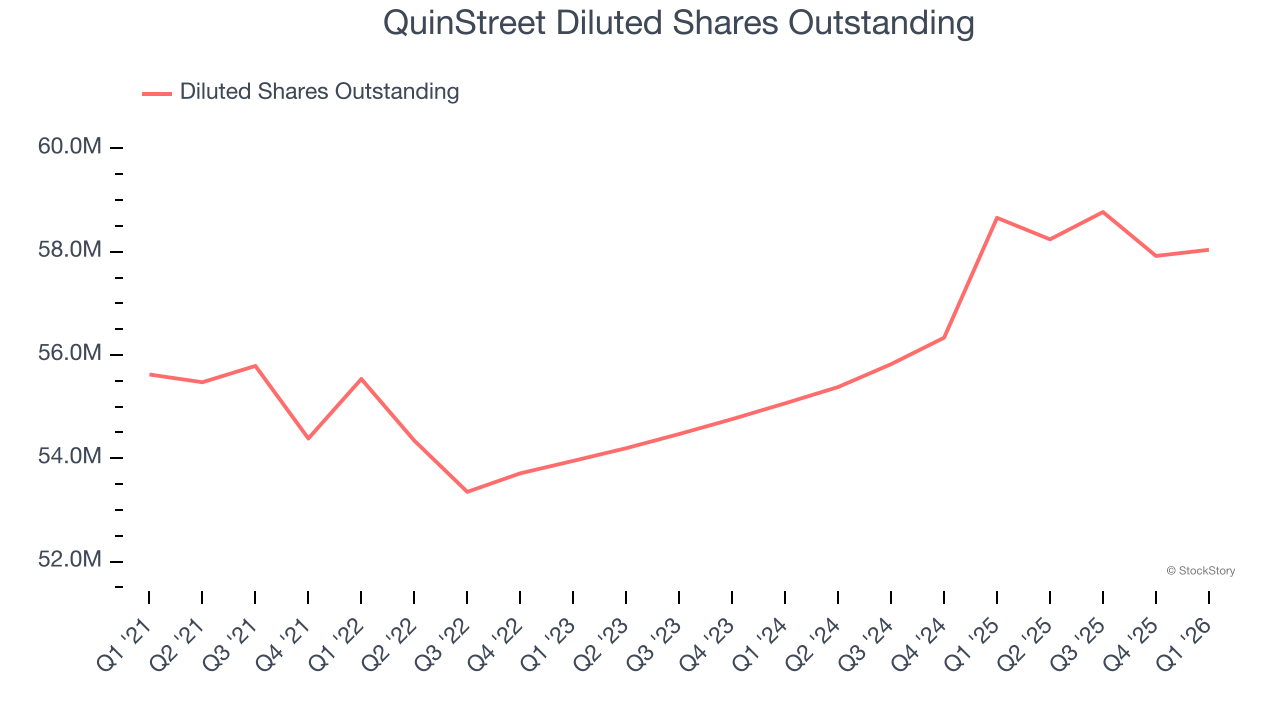
Like with revenue, we analyze EPS over a shorter period to see if we are missing a change in the business.
For QuinStreet, its two-year annual EPS growth of 628% was higher than its five-year trend. We love it when earnings growth accelerates, especially when it accelerates off an already high base.
In Q1, QuinStreet reported adjusted EPS of $0.31, up from $0.21 in the same quarter last year. Despite growing year on year, this print slightly missed analysts’ estimates, but we care more about long-term adjusted EPS growth than short-term movements. Over the next 12 months, Wall Street expects QuinStreet’s full-year EPS of $1.02 to grow 54.2%.
Key Takeaways from QuinStreet’s Q1 Results
We enjoyed seeing QuinStreet beat analysts’ revenue expectations this quarter. On the other hand, its EPS was in line. Zooming out, we think this was a mixed quarter. Investors were likely hoping for more, and shares traded down 2.8% to $13.00 immediately after reporting.
Is QuinStreet an attractive investment opportunity right now? What happened in the latest quarter matters, but not as much as longer-term business quality and valuation, when deciding whether to invest in this stock. We cover that in our actionable full research report which you can read here (it’s free).


