Fashion conglomerate Oxford Industries (NYSE: OXM) met Wall Street’s revenue expectations in Q1 CY2026, but sales were flat year on year at $391.4 million. On the other hand, next quarter’s revenue guidance of $390 million was less impressive, coming in 5.8% below analysts’ estimates. Its non-GAAP profit of $1.39 per share was 7.9% above analysts’ consensus estimates.
Is now the time to buy Oxford Industries? Find out by accessing our full research report, it’s free.
Oxford Industries (OXM) Q1 CY2026 Highlights:
- Revenue: $391.4 million vs analyst estimates of $391.8 million (flat year on year, in line)
- Adjusted EPS: $1.39 vs analyst estimates of $1.29 (7.9% beat)
- Adjusted EBITDA: $38.7 million (9.9% margin, 28.5% year-on-year decline)
- The company dropped its revenue guidance for the full year to $1.49 billion at the midpoint from $1.50 billion, a 0.8% decrease
- Management raised its full-year Adjusted EPS guidance to $2.50 at the midpoint, a 4.2% increase
- Operating Margin: 5.7%, down from 9.2% in the same quarter last year
- Free Cash Flow was -$14.87 million compared to -$27.37 million in the same quarter last year
- Market Capitalization: $643.1 million
Tom Chubb, Chairman and CEO, commented, “We delivered net sales in line with our expectations, led by mid-single-digit positive comps at Tommy Bahama, and adjusted EPS above our guidance range, fueled by better-than-expected gross margins. Our overall performance also reflects softer than expected results at Lilly Pulitzer and a challenging environment marked by weak consumer sentiment and higher energy prices. At the same time, we made important progress during the first quarter on several strategic initiatives in our merchandising and marketing functions that we believe will enhance the operating performance of each of our brands over the long term."
Company Overview
The parent company of Tommy Bahama, Oxford Industries (NYSE: OXM) is a lifestyle fashion conglomerate with brands that embody outdoor happiness.
Revenue Growth
Reviewing a company’s long-term sales performance reveals insights into its quality. Any business can put up a good quarter or two, but the best consistently grow over the long haul. Over the last five years, Oxford Industries grew its sales at a 11.6% annual rate. Though this growth is acceptable on an absolute basis, we need to see more than just topline growth for the consumer discretionary sector, which can display significant earnings volatility. This means our bar for the sector is particularly high, reflecting the non-essential and hit-driven nature of the products and services offered. Additionally, five-year CAGR starts around Covid, when revenue was depressed then rebounded.
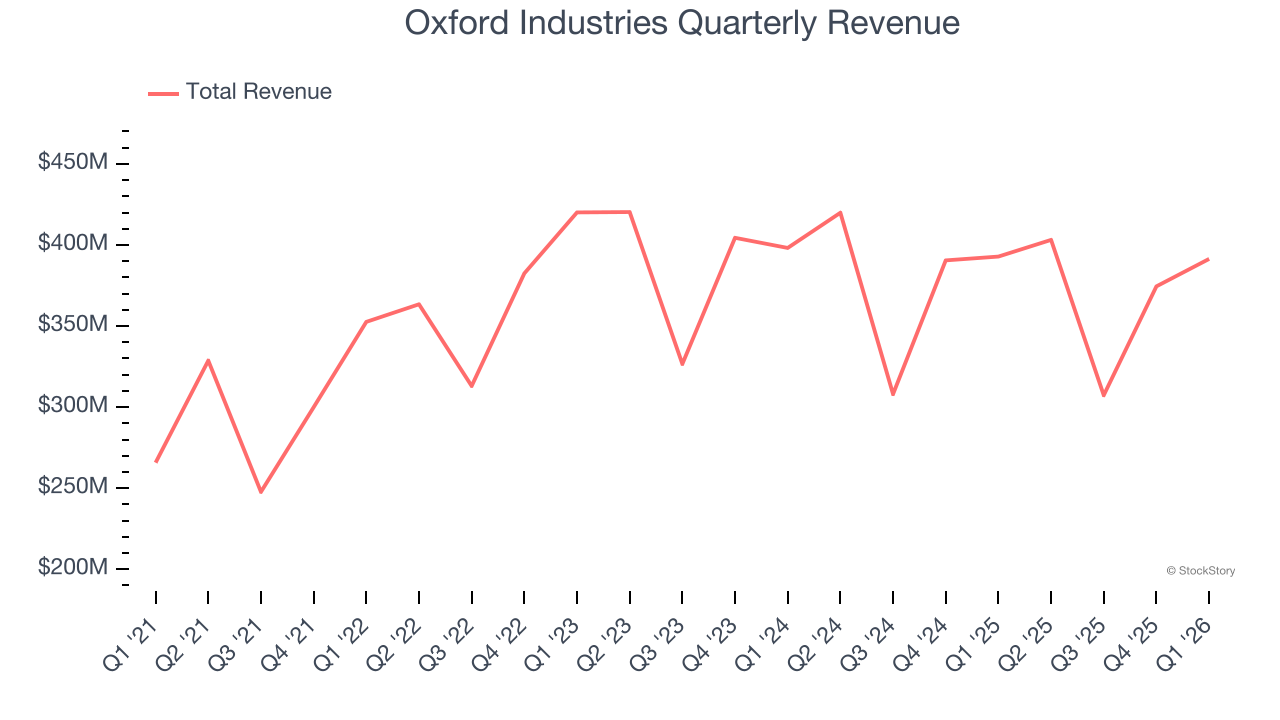
Long-term growth is the most important, but within consumer discretionary, product cycles are short and revenue can be hit-driven due to rapidly changing trends and consumer preferences. Oxford Industries’s performance shows it grew in the past but relinquished its gains over the last two years, as its revenue fell by 2.4% annually. 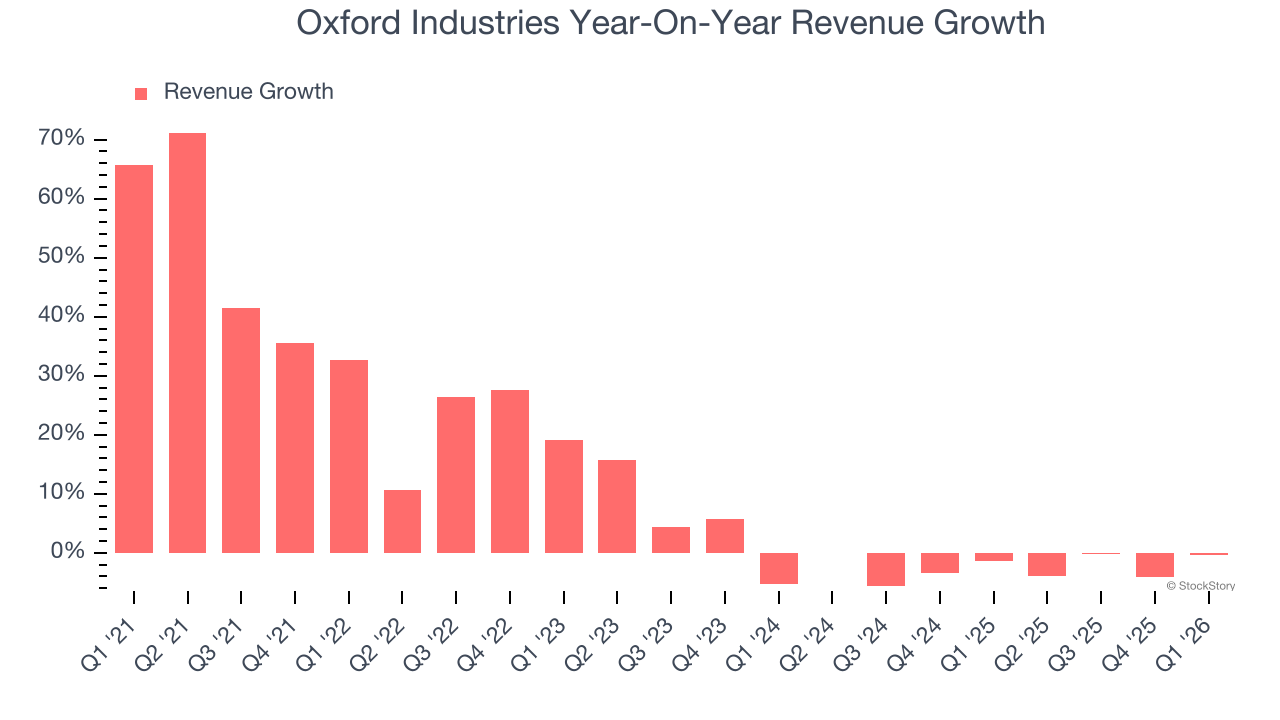
This quarter, Oxford Industries’s $391.4 million of revenue was flat year on year and in line with Wall Street’s estimates. Company management is currently guiding for a 3.3% year-on-year decline in sales next quarter.
Looking further ahead, sell-side analysts expect revenue to grow 2.8% over the next 12 months. Although this projection indicates its newer products and services will catalyze better top-line performance, it is still below average for the sector.
ONE MORE THING: The $21 AI Application Stock Wall Street Forgot. While Wall Street obsesses over who’s building AI, one company is already using it to print money. And nobody’s paying attention.
AI chip stocks trade at ridiculous valuations. This company processes a trillion consumer signals monthly using AI and trades at a third of the price. The gap won’t last. The institutions will figure it out. You need to see this first. Read the FREE Report Before They Notice.
Operating Margin
Operating margin is an important measure of profitability as it shows the portion of revenue left after accounting for all core expenses — everything from the cost of goods sold to advertising and wages. It’s also useful for comparing profitability across companies with different levels of debt and tax rates because it excludes interest and taxes.
Oxford Industries’s operating margin has shrunk over the last 12 months and averaged 1.9% over the last two years. The company’s profitability was mediocre for a consumer discretionary business and shows it couldn’t pass its higher operating expenses onto its customers.
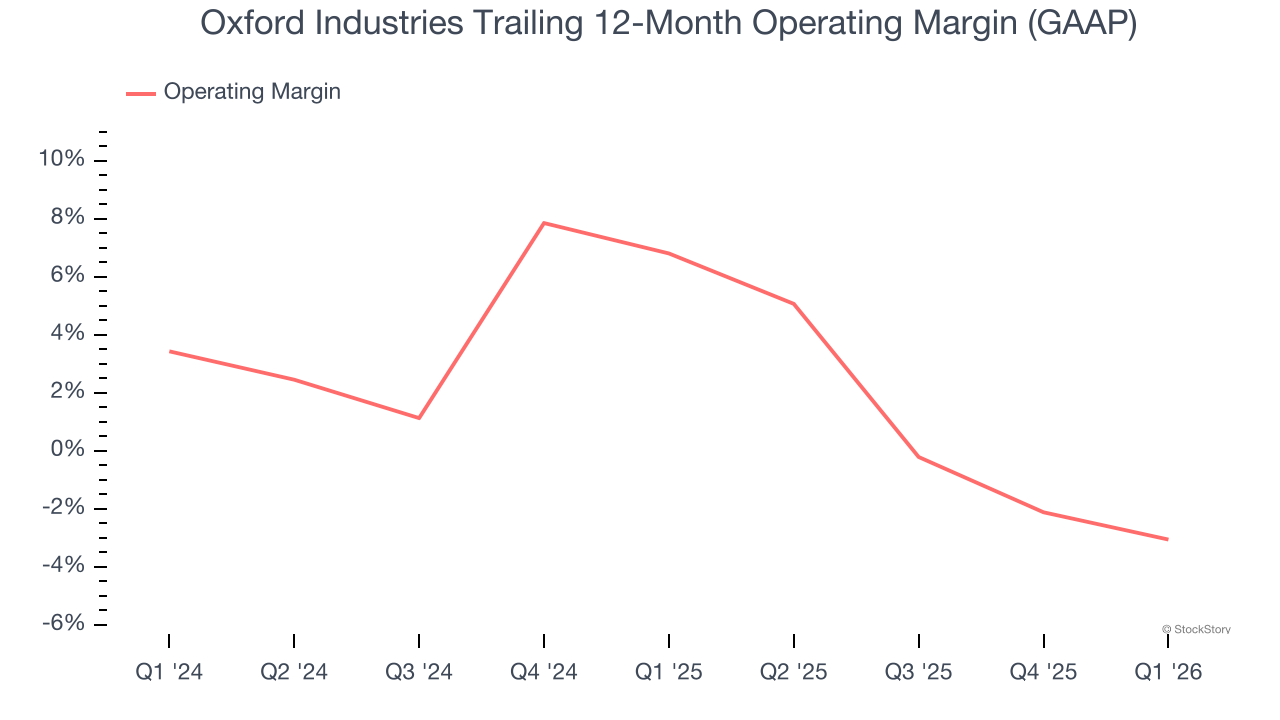
In Q1, Oxford Industries generated an operating margin profit margin of 5.7%, down 3.5 percentage points year on year. This contraction shows it was less efficient because its expenses increased relative to its revenue.
Earnings Per Share
We track the long-term change in earnings per share (EPS) for the same reason as long-term revenue growth. Compared to revenue, however, EPS highlights whether a company’s growth is profitable.
Oxford Industries’s EPS grew at a weak 6.4% compounded annual growth rate over the last five years, lower than its 11.6% annualized revenue growth. This tells us the company became less profitable on a per-share basis as it expanded due to non-fundamental factors such as interest expenses and taxes.
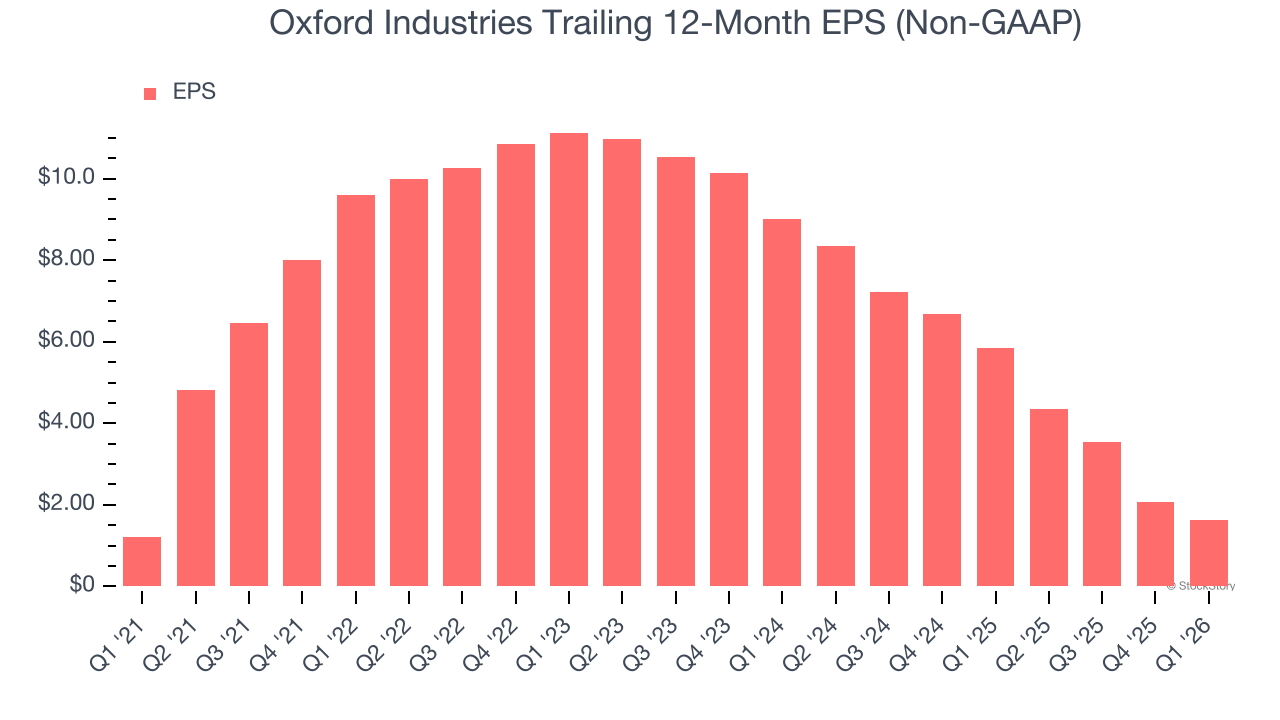
In Q1, Oxford Industries reported adjusted EPS of $1.39, down from $1.82 in the same quarter last year. Despite falling year on year, this print beat analysts’ estimates by 7.9%. Over the next 12 months, Wall Street expects Oxford Industries’s full-year EPS to grow 70.1% from $1.64 to $2.79.
Key Takeaways from Oxford Industries’s Q1 Results
It was encouraging to see Oxford Industries’s full-year EPS guidance beat analysts’ expectations. We were also glad its EPS outperformed Wall Street’s estimates. On the other hand, its EPS guidance for next quarter missed and its revenue guidance for next quarter fell short of Wall Street’s estimates. Overall, this was a weaker quarter. The stock traded down 11.4% to $38.32 immediately following the results.
Oxford Industries’s earnings report left more to be desired. Let’s look forward to see if this quarter has created an opportunity to buy the stock. The latest quarter does matter, but not nearly as much as longer-term fundamentals and valuation, when deciding if the stock is a buy. We cover that in our actionable full research report which you can read here (it’s free).