Personalized clothing company Stitch Fix (NASDAQ: SFIX) reported revenue ahead of Wall Street’s expectations in Q1 CY2026, with sales up 4.7% year on year to $340.3 million. Guidance for next quarter’s revenue was better than expected at $324.5 million at the midpoint, 0.7% above analysts’ estimates. Its GAAP loss of $0.01 per share was 82% above analysts’ consensus estimates.
Is now the time to buy Stitch Fix? Find out by accessing our full research report, it’s free.
Stitch Fix (SFIX) Q1 CY2026 Highlights:
- Revenue: $340.3 million vs analyst estimates of $334 million (4.7% year-on-year growth, 1.9% beat)
- EPS (GAAP): -$0.01 vs analyst estimates of -$0.06 (82% beat)
- Adjusted EBITDA: $13.24 million vs analyst estimates of $8.87 million (3.9% margin, 49.3% beat)
- Revenue Guidance for Q2 CY2026 is $324.5 million at the midpoint, roughly in line with what analysts were expecting
- EBITDA guidance for the full year is $50.5 million at the midpoint, above analyst estimates of $45.57 million
- Operating Margin: -1.2%, up from -3% in the same quarter last year
- Free Cash Flow Margin: 1.9%, down from 4.9% in the same quarter last year
- Active Clients: down 44,000 year on year
- Market Capitalization: $494.2 million
Company Overview
One of the original subscription box companies, Stitch Fix (NASDAQ: SFIX) is an online personal styling and fashion service that curates personalized clothing selections for customers.
Revenue Growth
Examining a company’s long-term performance can provide clues about its quality. Any business can put up a good quarter or two, but many enduring ones grow for years. Stitch Fix’s demand was weak over the last five years as its sales fell at a 7.5% annual rate. This wasn’t a great result and is a sign of poor business quality.
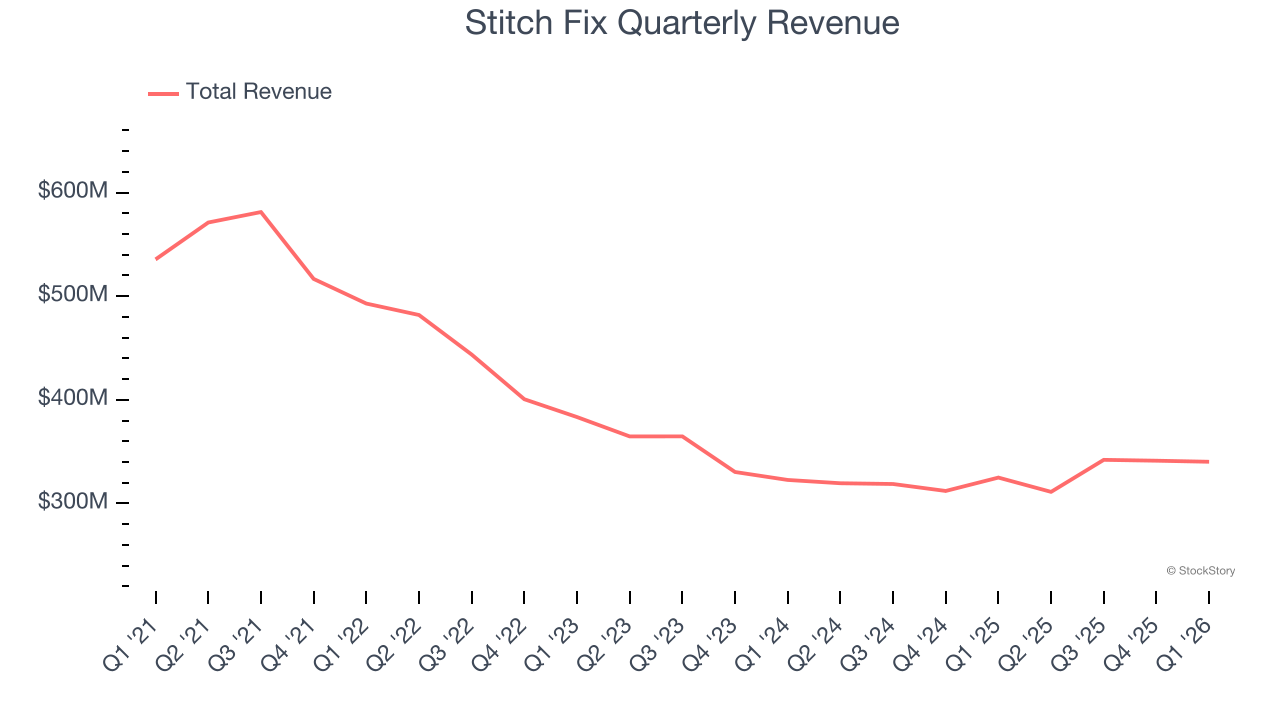
We at StockStory place the most emphasis on long-term growth, but within consumer discretionary, a stretched historical view may miss a company riding a successful new product or trend. Stitch Fix’s annualized revenue declines of 1.7% over the last two years suggest its demand continued shrinking. 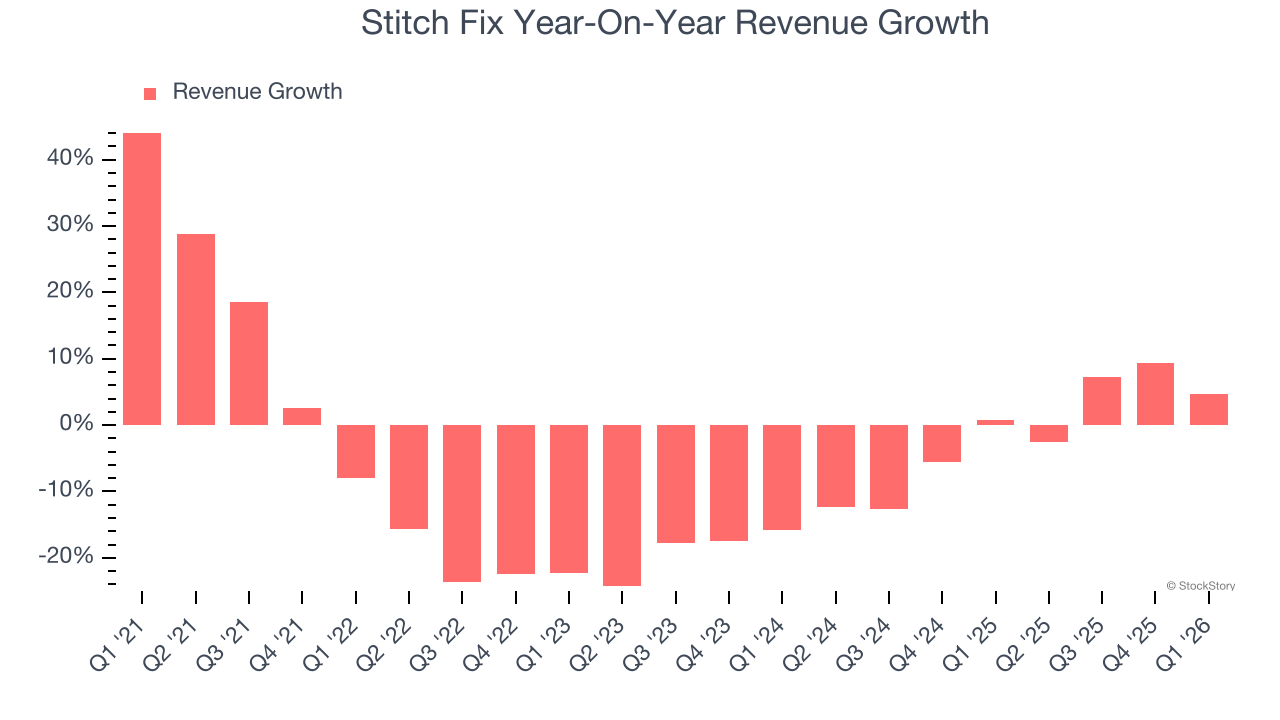
We can dig further into the company’s revenue dynamics by analyzing its number of active clients, which reached 2.31 million in the latest quarter. Over the last two years, Stitch Fix’s active clients averaged 9% year-on-year declines. Because this number is lower than its revenue growth during the same period, we can see the company’s monetization has risen. 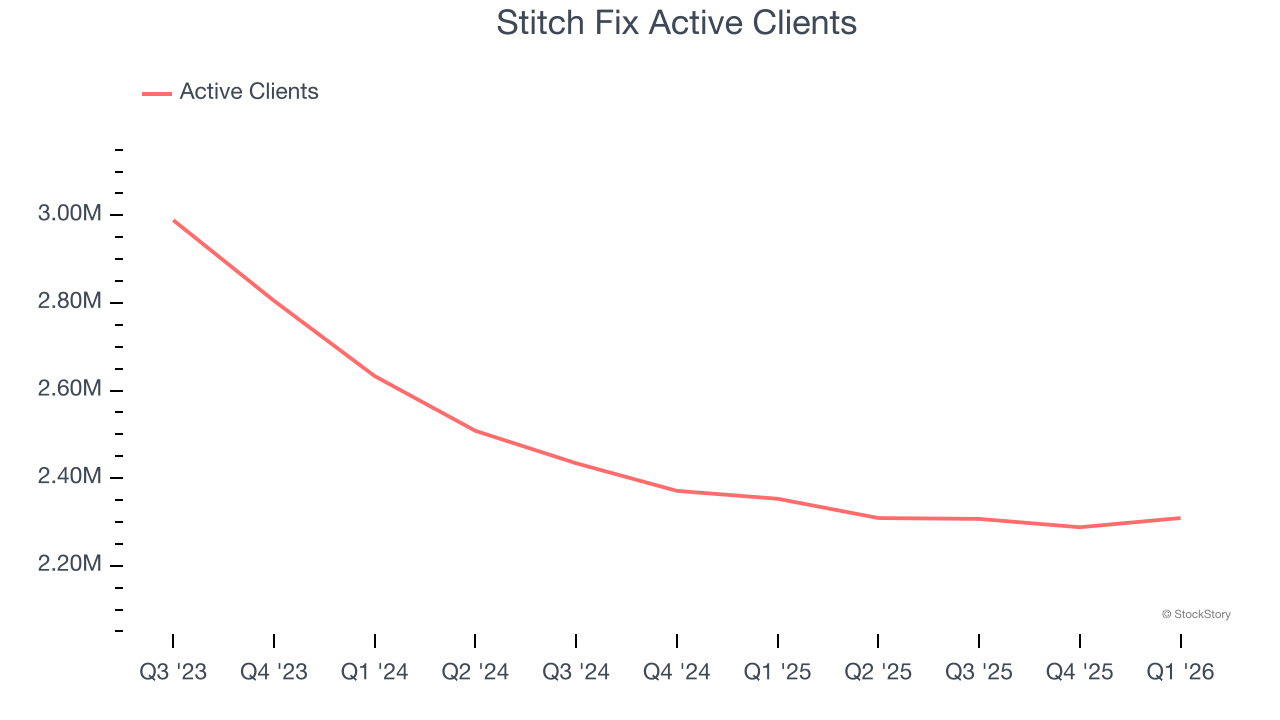
This quarter, Stitch Fix reported modest year-on-year revenue growth of 4.7% but beat Wall Street’s estimates by 1.9%. Company management is currently guiding for a 4.3% year-on-year increase in sales next quarter.
Looking further ahead, sell-side analysts expect revenue to grow 3.2% over the next 12 months. While this projection suggests its newer products and services will fuel better top-line performance, it is still below the sector average.
WHILE YOU’RE HERE: The Next Palantir? One satellite company captures images of every point on Earth. Every single day. The Pentagon wants it. Hedge funds are using it to beat earnings. You’ve probably never heard of it.
This is what the early days of Palantir looked like before it became a $437 billion giant. Same playbook. Different technology. If you missed Palantir, you need to see this. Claim The Stock Ticker for Free HERE.
Operating Margin
Stitch Fix’s operating margin has risen over the last 12 months, but it still averaged negative 3.8% over the last two years. This is due to its large expense base and inefficient cost structure.
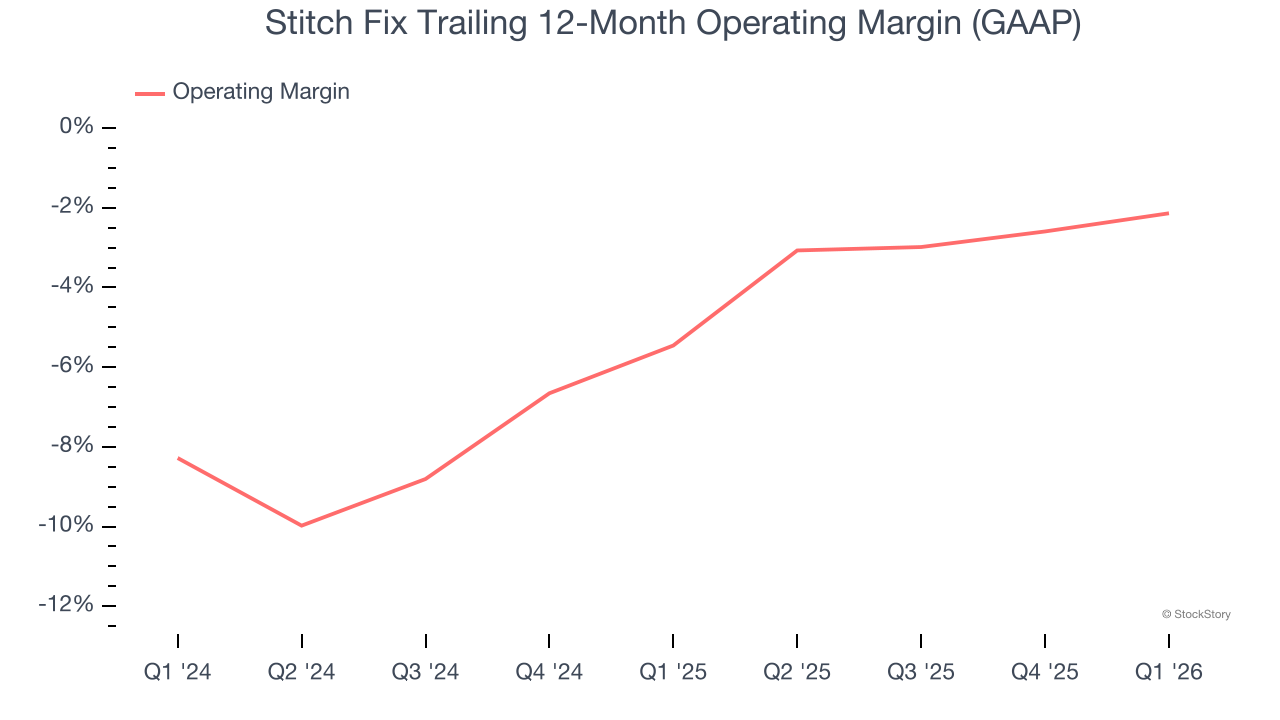
Stitch Fix’s operating margin was negative 1.2% this quarter. The company’s consistent lack of profits raises a flag.
Earnings Per Share
Revenue trends explain a company’s historical growth, but the long-term change in earnings per share (EPS) points to the profitability of that growth — for example, a company could inflate its sales through excessive spending on advertising and promotions.
Although Stitch Fix’s full-year earnings are still negative, it reduced its losses and improved its EPS by 27.7% annually over the last five years. The next few quarters will be critical for assessing its long-term profitability.
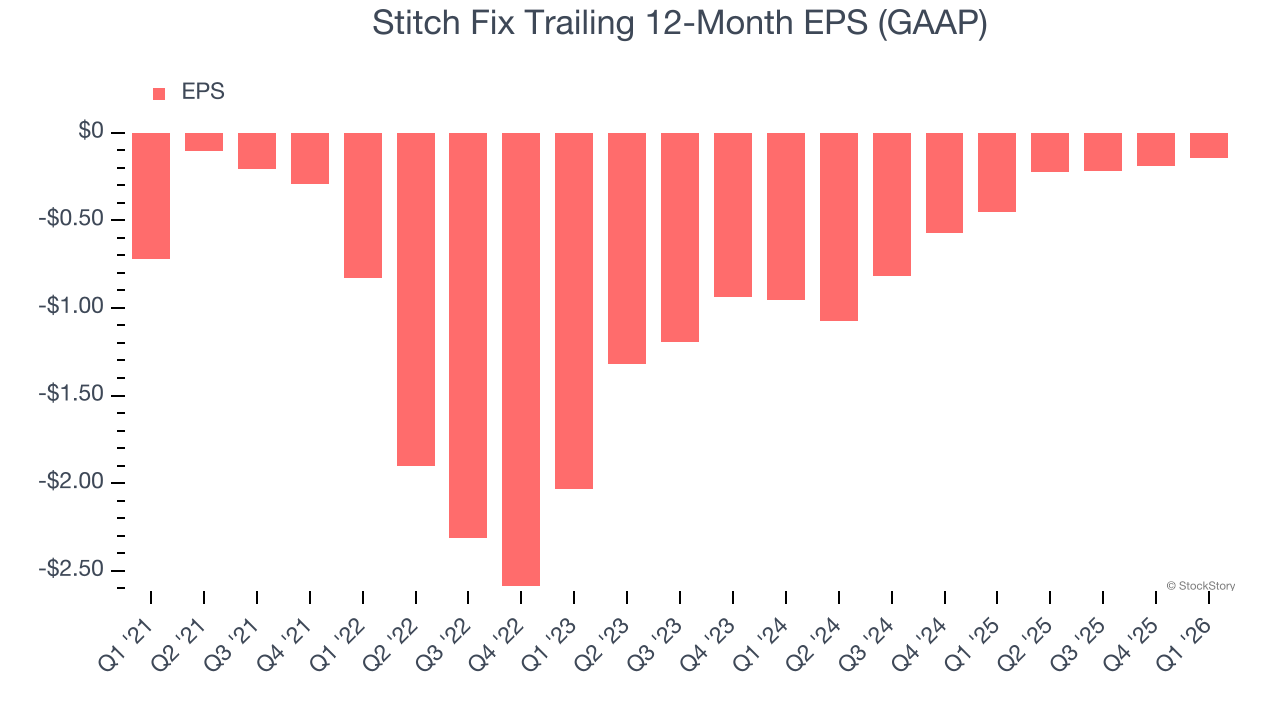
In Q1, Stitch Fix reported EPS of negative $0.01, up from negative $0.06 in the same quarter last year. This print easily cleared analysts’ estimates, and shareholders should be content with the results. Over the next 12 months, Wall Street expects Stitch Fix to improve its earnings losses. Analysts forecast its full-year EPS will improve from negative $0.14 to negative $0.12.
Key Takeaways from Stitch Fix’s Q1 Results
We were impressed by Stitch Fix’s optimistic EBITDA guidance for next quarter, which blew past analysts’ expectations. We were also glad its EPS outperformed Wall Street’s estimates. Zooming out, we think this was a solid print. The stock traded up 9.2% to $3.93 immediately following the results.
Stitch Fix put up rock-solid earnings, but one quarter doesn’t necessarily make the stock a buy. Let’s see if this is a good investment. We think that the latest quarter is only one piece of the longer-term business quality puzzle. Quality, when combined with valuation, can help determine if the stock is a buy. We cover that in our actionable full research report which you can read here (it’s free).