Over the past six months, Manhattan Associates’s stock price fell to $150.36. Shareholders have lost 15.8% of their capital, which is disappointing considering the S&P 500 has climbed by 11%. This might have investors contemplating their next move.
Is now the time to buy Manhattan Associates, or should you be careful about including it in your portfolio? Get the full breakdown from our expert analysts, it’s free.
Why Is Manhattan Associates Not Exciting?
Even with the cheaper entry price, we’re cautious about Manhattan Associates. Here are three reasons why there are better opportunities than MANH, plus one stock we’d rather own.
1. Weak Billings Point to Soft Demand
Billings is a non-GAAP metric that is often called “cash revenue” because it shows how much money the company has collected from customers in a certain period. This is different from revenue, which must be recognized in pieces over the length of a contract.
Manhattan Associates’s billings came in at $301.8 million in Q1, and over the last four quarters, its year-on-year growth averaged 5.8%. This performance was underwhelming and suggests that increasing competition is causing challenges in acquiring/retaining customers. 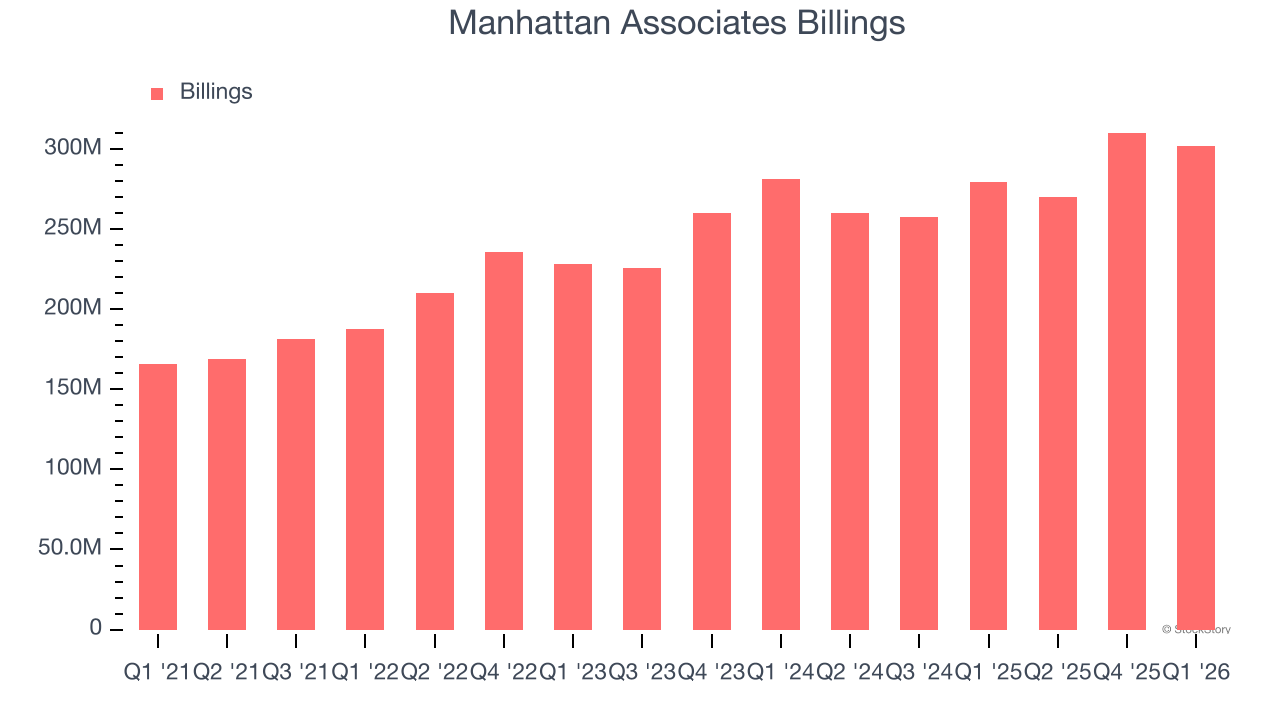
2. Low Gross Margin Reveals Weak Structural Profitability
For software companies like Manhattan Associates, gross profit tells us how much money remains after paying for the base cost of products and services (typically servers, licenses, and certain personnel). These costs are usually low as a percentage of revenue, explaining why software is more lucrative than other sectors.
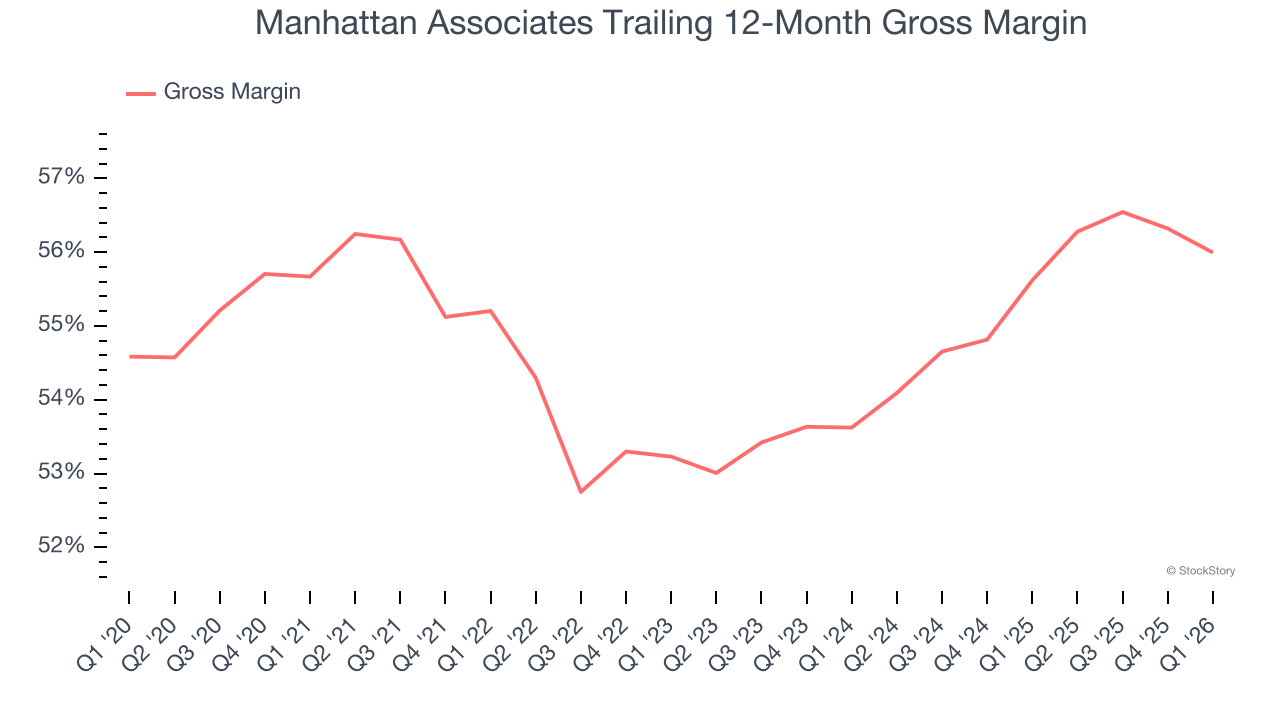
Manhattan Associates’s gross margin is substantially worse than most software businesses, signaling it has relatively high infrastructure costs compared to asset-lite businesses like ServiceNow. As you can see below, it averaged a 56% gross margin over the last year. Said differently, Manhattan Associates had to pay a chunky $44.00 to its service providers for every $100 in revenue.
The market not only cares about gross margin levels but also how they change over time because expansion creates firepower for profitability and free cash generation. Manhattan Associates has seen gross margins improve by 2.4 percentage points over the last 2 year, which is solid in the software space.
3. Operating Margin in Limbo
Many software businesses adjust their profits for stock-based compensation (SBC), but we prioritize GAAP operating margin because SBC is a real expense used to attract and retain engineering and sales talent. This metric shows how much revenue remains after accounting for all core expenses — everything from the cost of goods sold to sales and R&D.
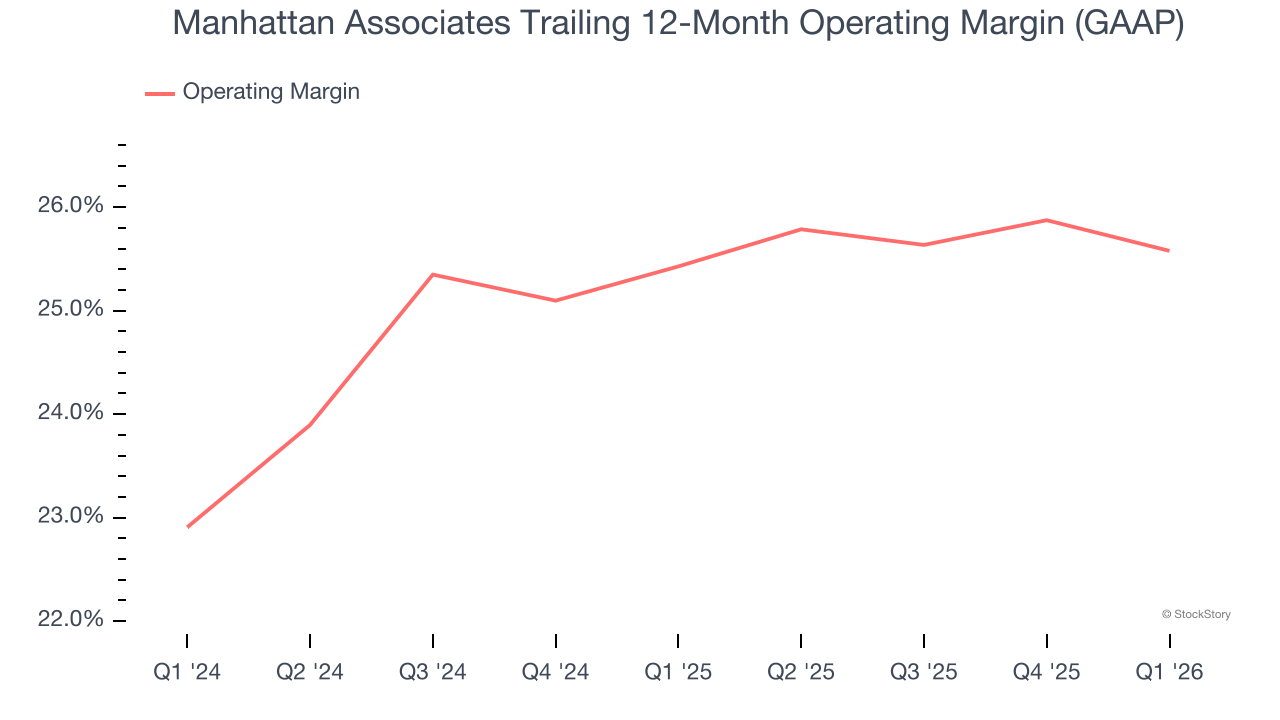
Looking at the trend in its profitability, Manhattan Associates’s operating margin might have fluctuated slightly but has generally stayed the same over the last two years. This raises questions about the company’s expense base because its revenue growth should have given it leverage on its fixed costs, resulting in better economies of scale and profitability. Its operating margin for the trailing 12 months was 25.6%.
Final Judgment
Manhattan Associates isn’t a terrible business, but it doesn’t pass our quality test. Following the recent decline, the stock trades at 7.9× forward price-to-sales (or $150.36 per share). Beauty is in the eye of the beholder, but our analysis shows the upside isn’t great compared to the potential downside. We’re pretty confident there are more exciting stocks to buy at the moment. We’d recommend looking at one of our top software and edge computing picks.
Stocks We Would Buy Instead of Manhattan Associates
ONE MORE THING: Top 6 Stocks for This Week. This market is separating quality stocks from expensive ones fast. AI is taking down whole sectors with no warning. In a rotation this fast, you need more than a list of good companies.
Our AI system flagged Palantir before it ran 1,662%. AppLovin before it ran 753%. Nvidia before it ran 1,178%. Each week it produces 6 new names that pass the same tests. Get Our Top 6 Stocks for Free HERE.
Stocks that have made our list include now familiar names such as Nvidia (+1,326% between June 2020 and June 2025) as well as under-the-radar businesses like the once-micro-cap company Tecnoglass (+1,754% five-year return). Find your next big winner with StockStory today.