
Medical device company ICU Medical (NASDAQ: ICUI) beat Wall Street’s revenue expectations in Q1 CY2026, but sales fell by 11.6% year on year to $530.2 million. Its non-GAAP profit of $1.97 per share was 12.5% above analysts’ consensus estimates.
Is now the time to buy ICU Medical? Find out by accessing our full research report, it’s free.
ICU Medical (ICUI) Q1 CY2026 Highlights:
- Revenue: $530.2 million vs analyst estimates of $519.6 million (11.6% year-on-year decline, 2% beat)
- Adjusted EPS: $1.97 vs analyst estimates of $1.75 (12.5% beat)
- Adjusted EBITDA: $98.68 million vs analyst estimates of $95.92 million (18.6% margin, 2.9% beat)
- Operating Margin: 2.6%, down from 4.9% in the same quarter last year
- Free Cash Flow Margin: 5.2%, similar to the same quarter last year
- Market Capitalization: $2.99 billion
Vivek Jain, ICU Medical’s Chief Executive Officer, said, “First quarter results were generally in line with our expectations."
Company Overview
Founded in 1984 and named for its initial focus on intensive care units, ICU Medical (NASDAQ: ICUI) develops and manufactures medical products for infusion therapy, vascular access, and vital care applications used in hospitals and other healthcare settings.
Revenue Growth
Examining a company’s long-term performance can provide clues about its quality. Any business can have short-term success, but a top-tier one grows for years. Luckily, ICU Medical’s sales grew at a decent 11.9% compounded annual growth rate over the last five years. Its growth was slightly above the average healthcare company and shows its offerings resonate with customers.
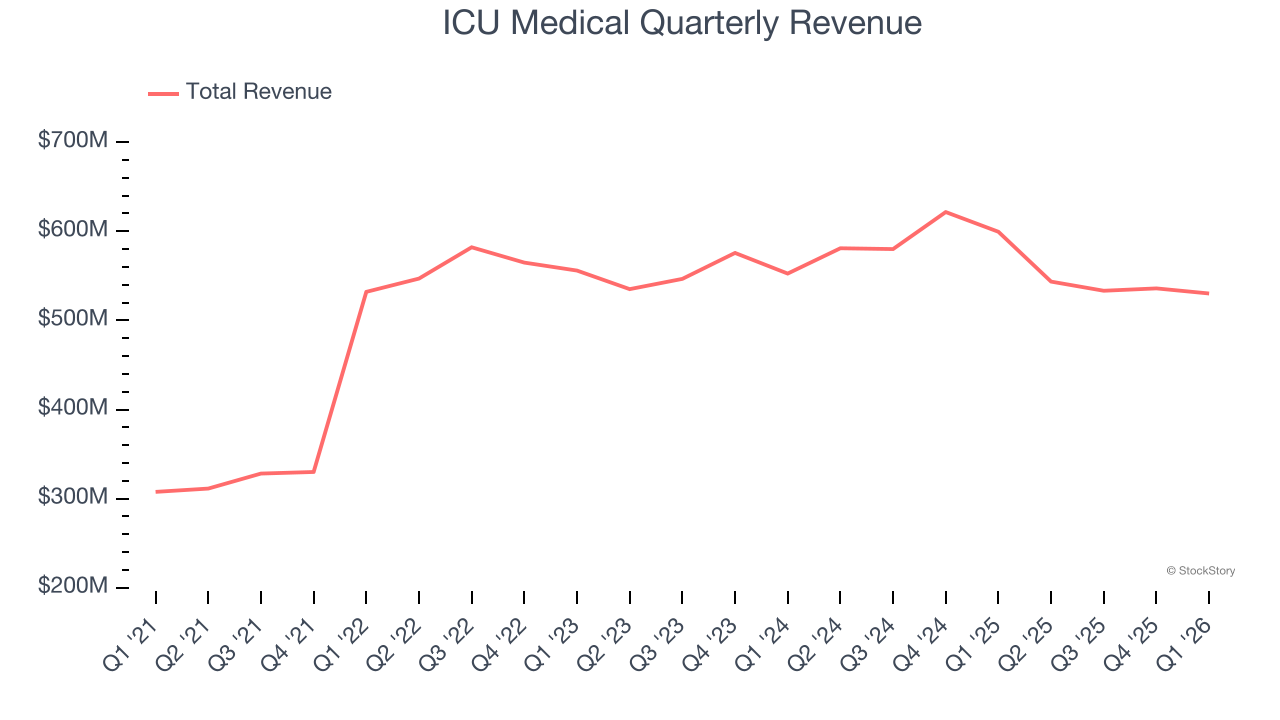
Long-term growth is the most important, but within healthcare, a half-decade historical view may miss new innovations or demand cycles. ICU Medical’s recent performance marks a sharp pivot from its five-year trend as its revenue has shown annualized declines of 1.5% over the last two years. 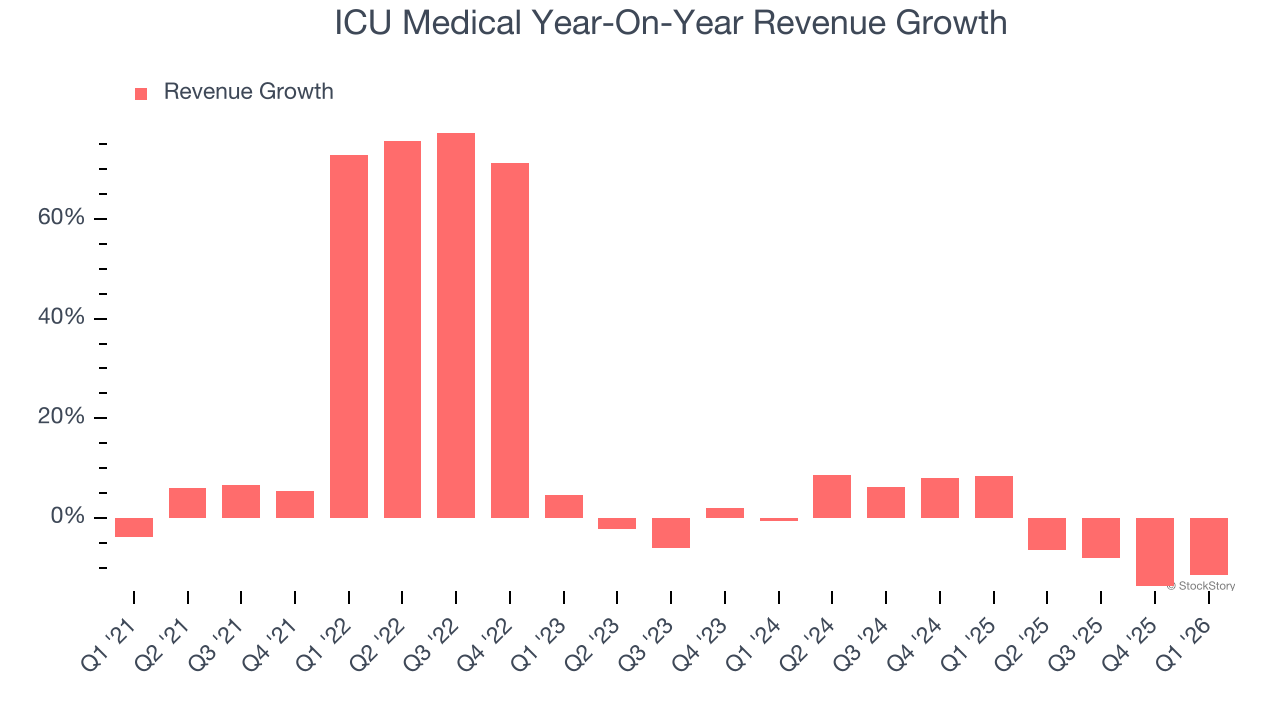
This quarter, ICU Medical’s revenue fell by 11.6% year on year to $530.2 million but beat Wall Street’s estimates by 2%.
Looking ahead, sell-side analysts expect revenue to grow 2.3% over the next 12 months. While this projection implies its newer products and services will spur better top-line performance, it is still below average for the sector.
ALSO WORTH WATCHING: Nvidia’s Quiet Partner. Nvidia’s chips cost a hundred grand. The connectors that make them work cost even more. One company makes them all.
Every AI server needs specialized infrastructure the chip companies don’t make. High-speed cables. Power connectors. Thermal sensors. This 90-year-old company built a monopoly on it. The AI boom just started. This stock is still flying under the radar. Claim The Stock Ticker Here for FREE.
Adjusted Operating Margin
ICU Medical has done a decent job managing its cost base over the last five years. The company has produced an average adjusted operating margin of 13%, higher than the broader healthcare sector.
Analyzing the trend in its profitability, ICU Medical’s adjusted operating margin decreased by 1.4 percentage points over the last five years. This raises questions about the company’s expense base because its revenue growth should have given it leverage on its fixed costs, resulting in better economies of scale and profitability.
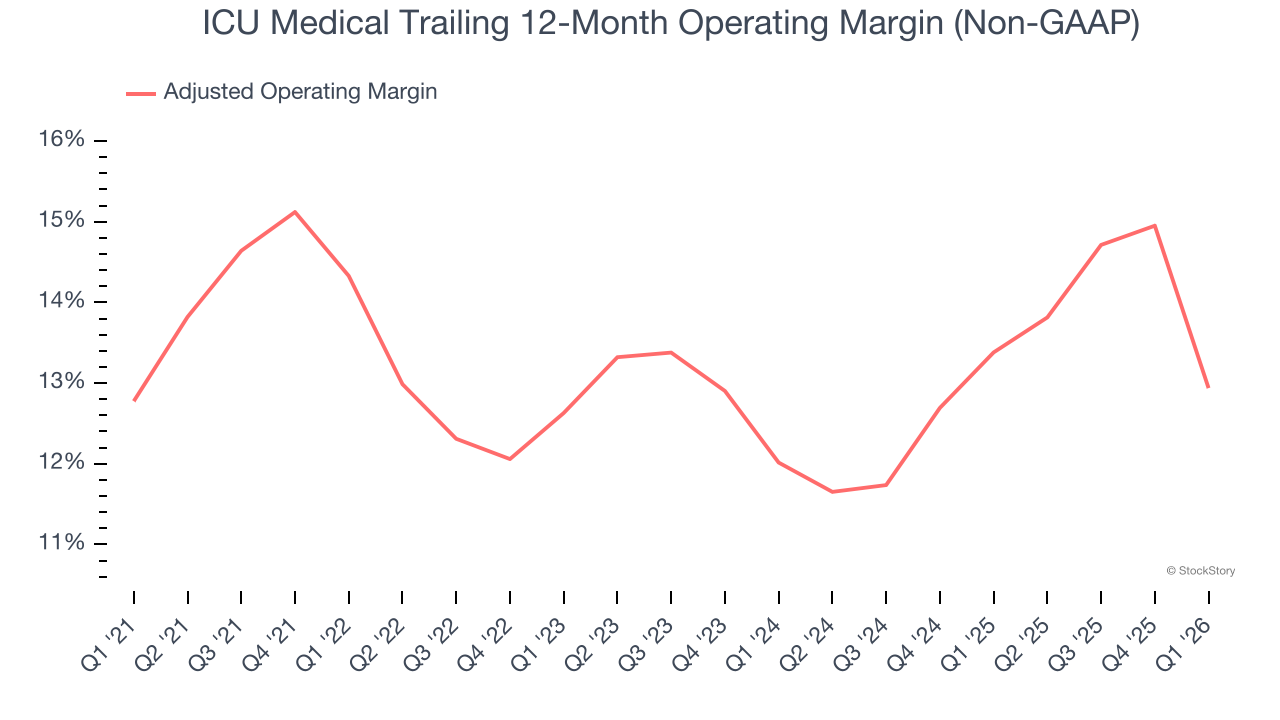
In Q1, ICU Medical generated an adjusted operating margin profit margin of 5.2%, down 8.3 percentage points year on year. This contraction shows it was less efficient because its expenses increased relative to its revenue.
Earnings Per Share
We track the long-term change in earnings per share (EPS) for the same reason as long-term revenue growth. Compared to revenue, however, EPS highlights whether a company’s growth is profitable.
ICU Medical’s EPS grew at an unimpressive 2.9% compounded annual growth rate over the last five years, lower than its 11.9% annualized revenue growth. This tells us the company became less profitable on a per-share basis as it expanded.
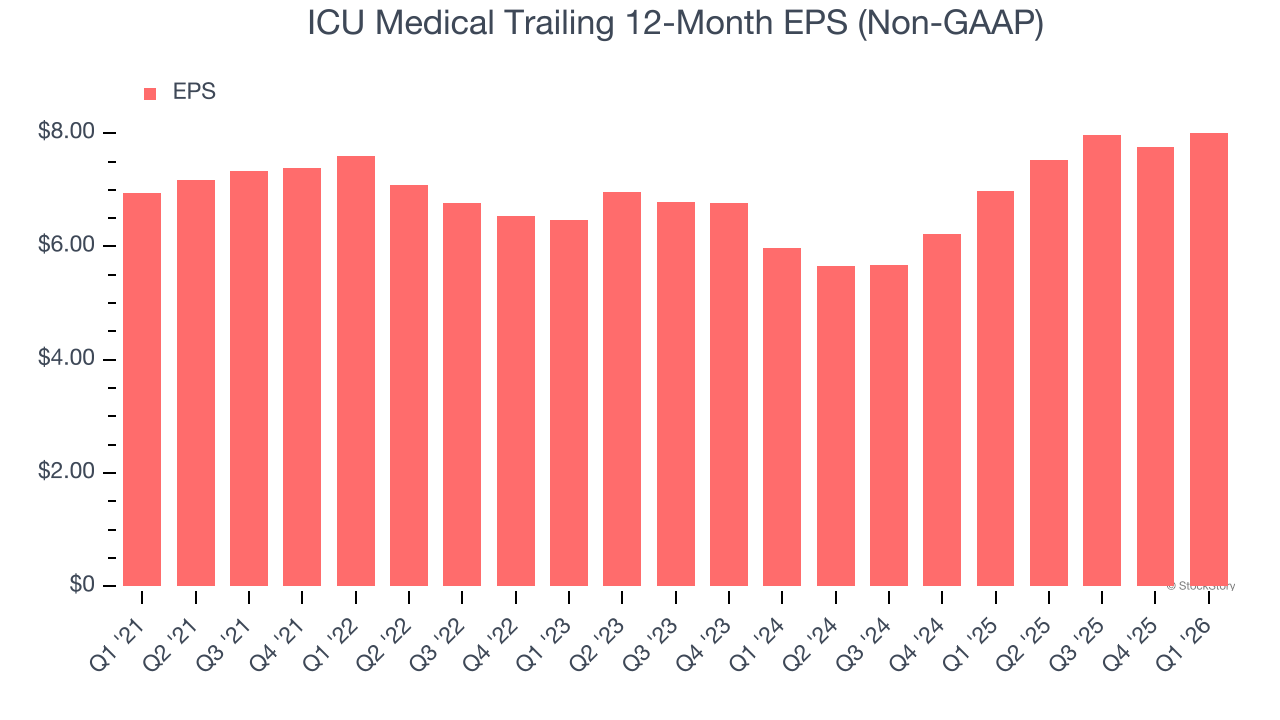
We can take a deeper look into ICU Medical’s earnings to better understand the drivers of its performance. As we mentioned earlier, ICU Medical’s adjusted operating margin declined by 1.4 percentage points over the last five years. Its share count also grew by 16.1%, meaning the company not only became less efficient with its operating expenses but also diluted its shareholders. 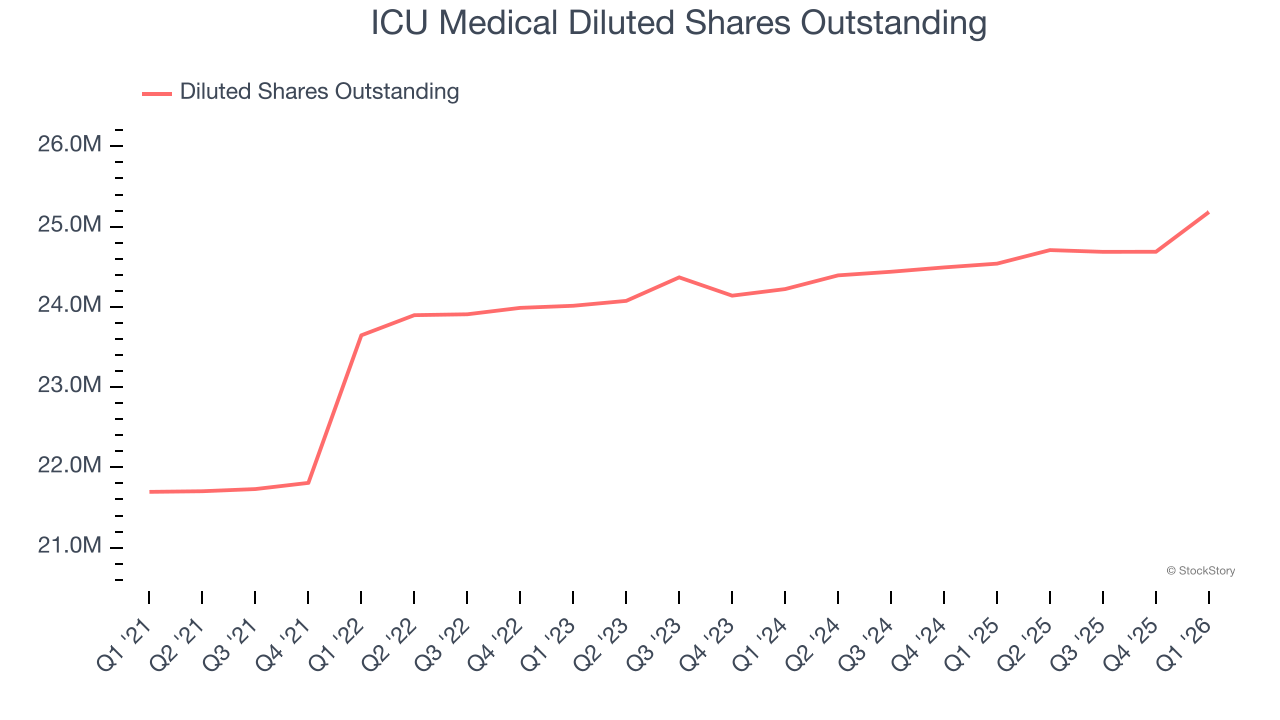
In Q1, ICU Medical reported adjusted EPS of $1.97, up from $1.72 in the same quarter last year. This print easily cleared analysts’ estimates, and shareholders should be content with the results. Over the next 12 months, Wall Street expects ICU Medical’s full-year EPS of $8.01 to grow 3.9%.
Key Takeaways from ICU Medical’s Q1 Results
It was good to see ICU Medical beat analysts’ EPS expectations this quarter. We were also happy its revenue outperformed Wall Street’s estimates. Overall, we think this was a solid quarter with some key areas of upside. The stock remained flat at $123.16 immediately following the results.
Is ICU Medical an attractive investment opportunity at the current price? We think that the latest quarter is only one piece of the longer-term business quality puzzle. Quality, when combined with valuation, can help determine if the stock is a buy. We cover that in our actionable full research report which you can read here (it’s free).