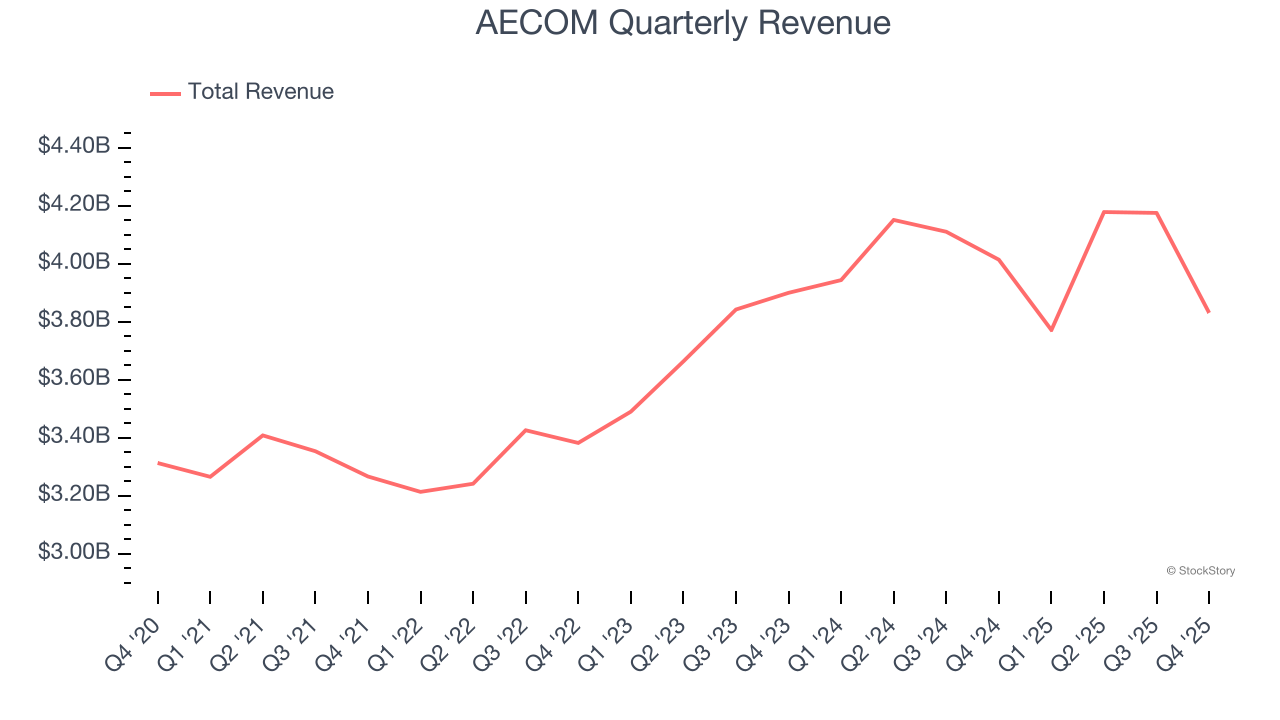
Infrastructure consulting service company AECOM (NYSE: ACM) announced better-than-expected revenue in Q4 CY2025, but sales fell by 4.6% year on year to $3.83 billion. Its non-GAAP profit of $1.29 per share was 10.9% above analysts’ consensus estimates.
Is now the time to buy AECOM? Find out by accessing our full research report, it’s free.
AECOM (ACM) Q4 CY2025 Highlights:
- Revenue: $3.83 billion vs analyst estimates of $3.74 billion (4.6% year-on-year decline, 2.5% beat)
- Adjusted EPS: $1.29 vs analyst estimates of $1.16 (10.9% beat)
- Adjusted EBITDA: $286.8 million vs analyst estimates of $265.9 million (7.5% margin, 7.9% beat)
- Management raised its full-year Adjusted EPS guidance to $5.95 at the midpoint, a 3.5% increase
- EBITDA guidance for the full year is $1.29 billion at the midpoint, above analyst estimates of $1.21 billion
- Operating Margin: 5.8%, in line with the same quarter last year
- Free Cash Flow Margin: 1.1%, down from 2.8% in the same quarter last year
- Backlog: $25.96 billion at quarter end, up 8.7% year on year
- Market Capitalization: $13.06 billion
Company Overview
Founded in 1990 when a group of engineers from five companies decided to merge, AECOM (NYSE: ACM) provides various infrastructure consulting services.
Revenue Growth
A company’s long-term performance is an indicator of its overall quality. Any business can have short-term success, but a top-tier one grows for years. Unfortunately, AECOM’s 3.7% annualized revenue growth over the last five years was sluggish. This was below our standard for the industrials sector and is a rough starting point for our analysis.
We at StockStory place the most emphasis on long-term growth, but within industrials, a half-decade historical view may miss cycles, industry trends, or a company capitalizing on catalysts such as a new contract win or a successful product line. AECOM’s annualized revenue growth of 3.5% over the last two years aligns with its five-year trend, suggesting its demand was consistently weak. 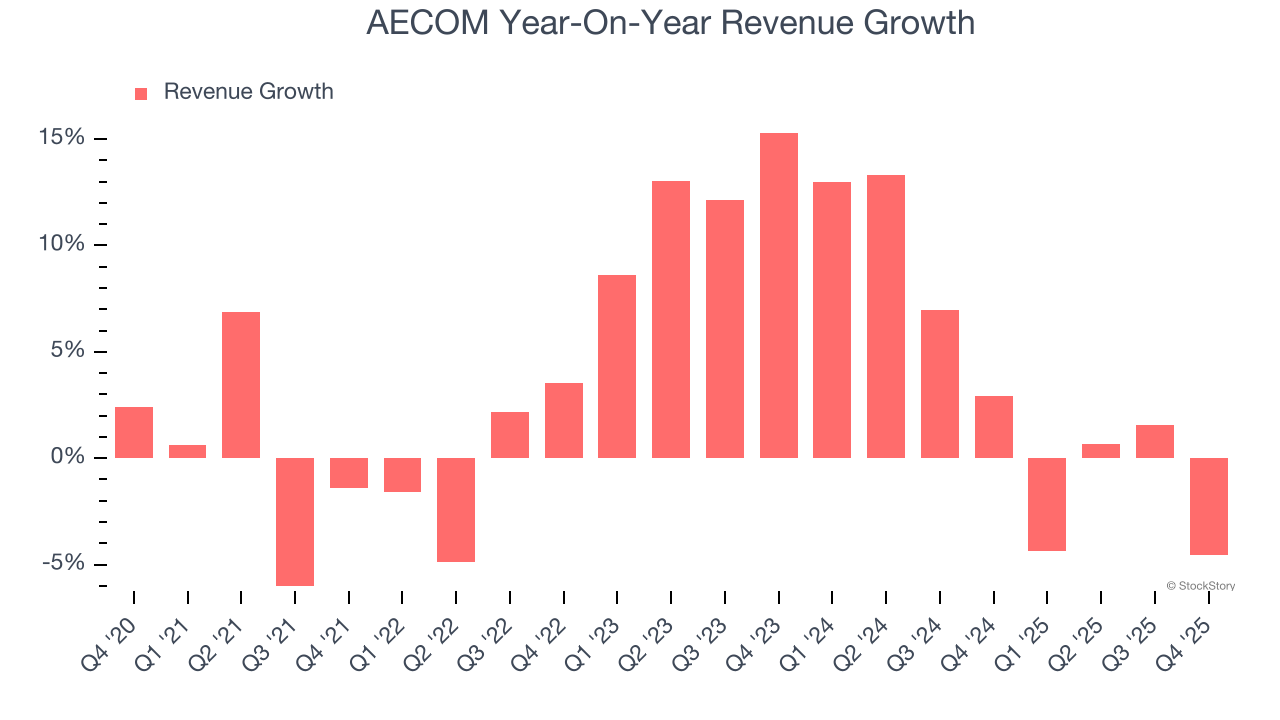
We can better understand the company’s revenue dynamics by analyzing its backlog, or the value of its outstanding orders that have not yet been executed or delivered. AECOM’s backlog reached $25.96 billion in the latest quarter and averaged 3.7% year-on-year growth over the last two years. Because this number is in line with its revenue growth, we can see the company effectively balanced its new order intake and fulfillment processes. 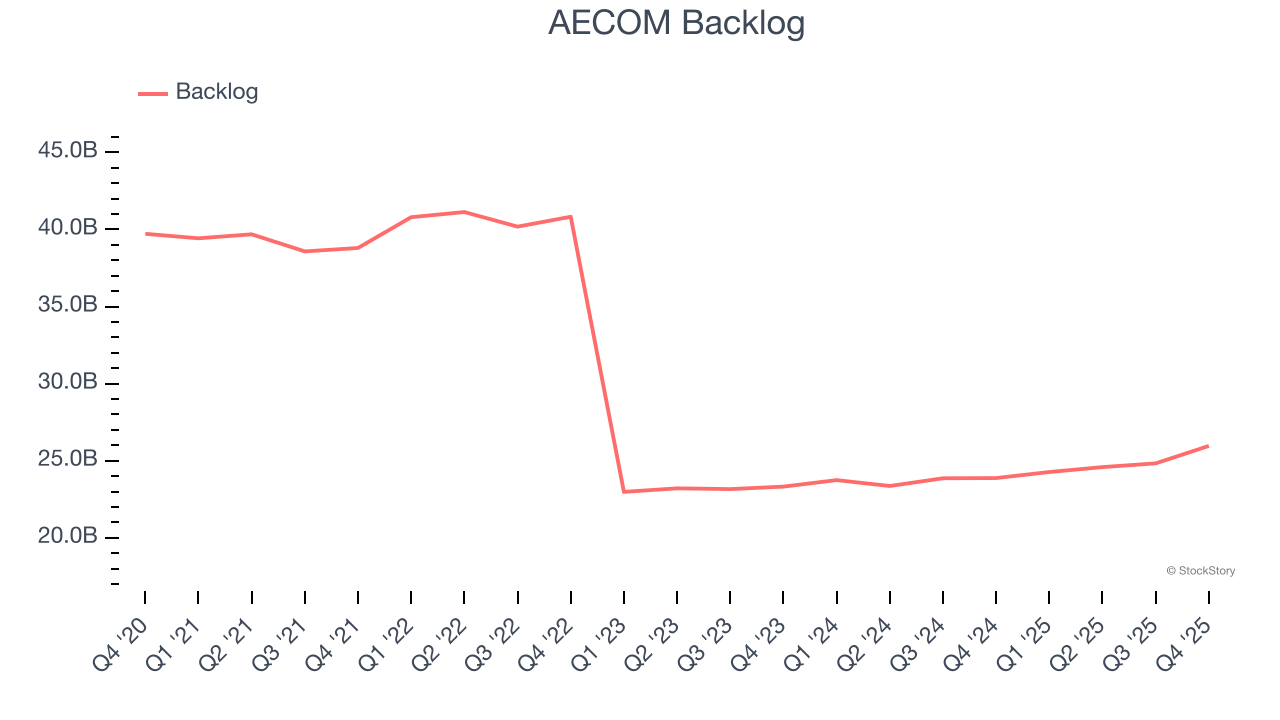
This quarter, AECOM’s revenue fell by 4.6% year on year to $3.83 billion but beat Wall Street’s estimates by 2.5%.
Looking ahead, sell-side analysts expect revenue to decline by 3.4% over the next 12 months, a deceleration versus the last two years. This projection doesn't excite us and suggests its products and services will face some demand challenges.
While Wall Street chases Nvidia at all-time highs, an under-the-radar semiconductor supplier is dominating a critical AI component these giants can’t build without. Click here to access our free report one of our favorites growth stories.
Operating Margin
AECOM was profitable over the last five years but held back by its large cost base. Its average operating margin of 4.8% was weak for an industrials business.
On the plus side, AECOM’s operating margin rose by 1.4 percentage points over the last five years, as its sales growth gave it operating leverage.
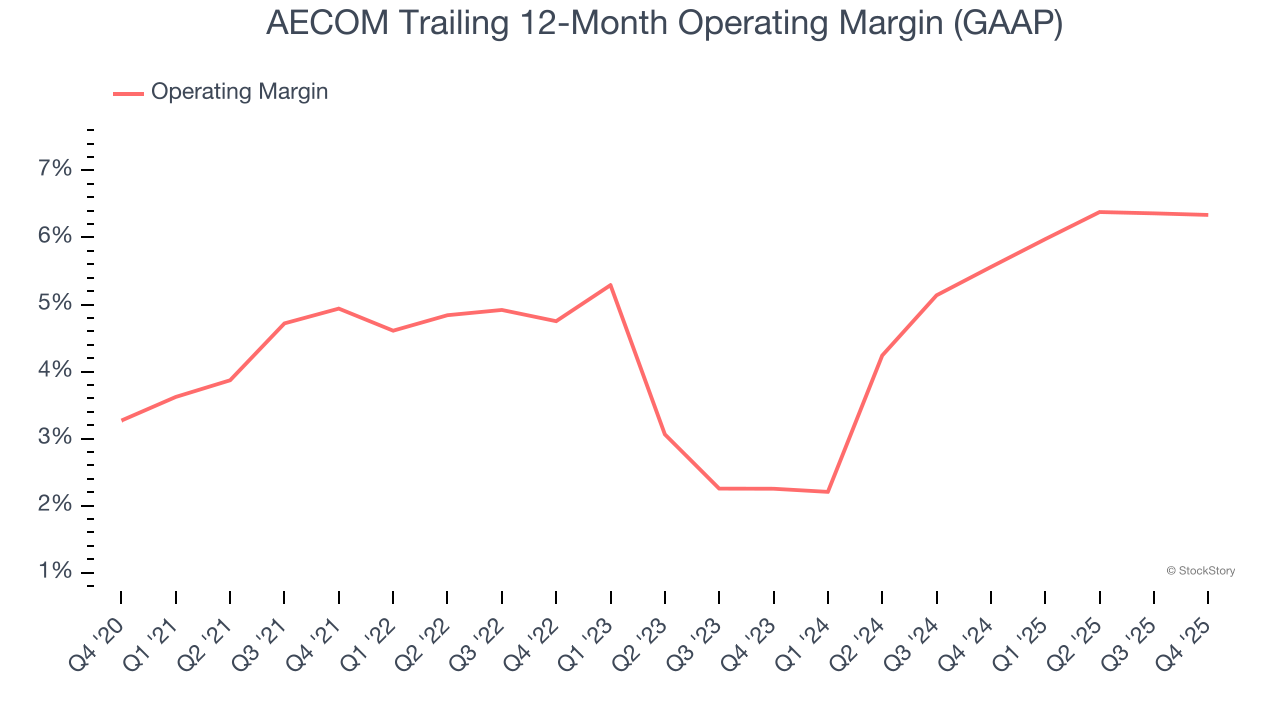
In Q4, AECOM generated an operating margin profit margin of 5.8%, in line with the same quarter last year. This indicates the company’s overall cost structure has been relatively stable.
Earnings Per Share
We track the long-term change in earnings per share (EPS) for the same reason as long-term revenue growth. Compared to revenue, however, EPS highlights whether a company’s growth is profitable.
AECOM’s EPS grew at an astounding 17.7% compounded annual growth rate over the last five years, higher than its 3.7% annualized revenue growth. This tells us the company became more profitable on a per-share basis as it expanded.
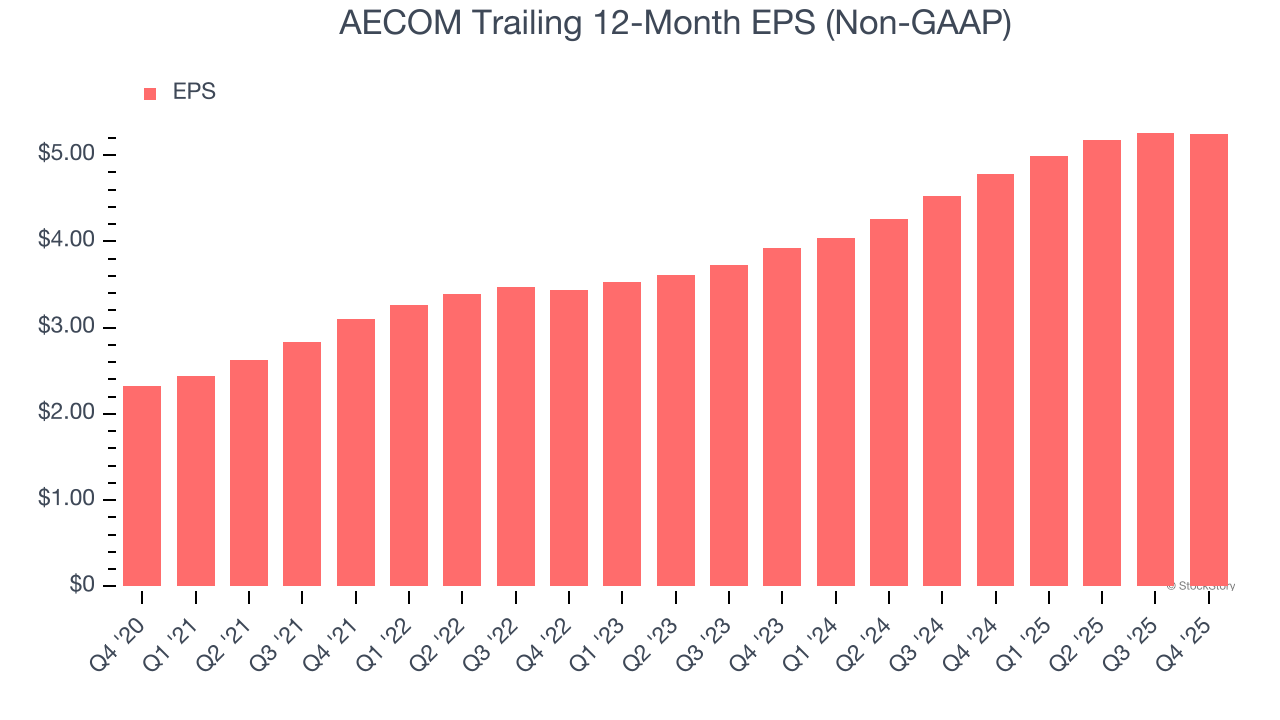
We can take a deeper look into AECOM’s earnings quality to better understand the drivers of its performance. As we mentioned earlier, AECOM’s operating margin was flat this quarter but expanded by 1.4 percentage points over the last five years. On top of that, its share count shrank by 14.2%. These are positive signs for shareholders because improving profitability and share buybacks turbocharge EPS growth relative to revenue growth. 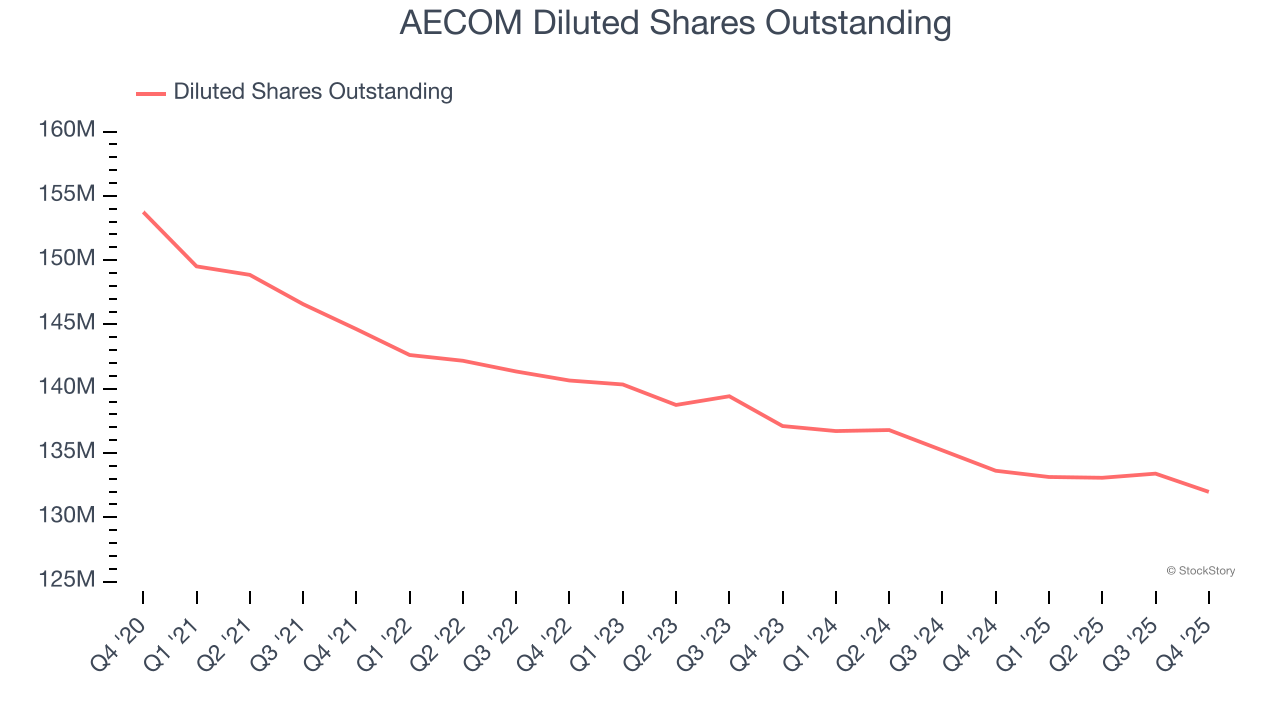
Like with revenue, we analyze EPS over a shorter period to see if we are missing a change in the business.
For AECOM, its two-year annual EPS growth of 15.6% was lower than its five-year trend. We still think its growth was good and hope it can accelerate in the future.
In Q4, AECOM reported adjusted EPS of $1.29, down from $1.31 in the same quarter last year. Despite falling year on year, this print easily cleared analysts’ estimates. Over the next 12 months, Wall Street expects AECOM’s full-year EPS of $5.24 to grow 2.5%.
Key Takeaways from AECOM’s Q4 Results
We were impressed by how significantly AECOM blew past analysts’ EBITDA expectations this quarter. We were also glad its full-year EBITDA guidance trumped Wall Street’s estimates. Zooming out, we think this was a solid print. The stock traded up 3% to $105.76 immediately after reporting.
AECOM had an encouraging quarter, but one earnings result doesn’t necessarily make the stock a buy. Let’s see if this is a good investment. The latest quarter does matter, but not nearly as much as longer-term fundamentals and valuation, when deciding if the stock is a buy. We cover that in our actionable full research report which you can read here (it’s free).