
Kitchen product manufacturer Middleby (NASDAQ: MIDD) reported Q1 CY2026 results topping the market’s revenue expectations, but sales fell by 7.4% year on year to $839.9 million. Guidance for next quarter’s revenue was better than expected at $832.5 million at the midpoint, 0.9% above analysts’ estimates. Its non-GAAP profit of $2.16 per share was 11.5% above analysts’ consensus estimates.
Is now the time to buy Middleby? Find out by accessing our full research report, it’s free.
Middleby (MIDD) Q1 CY2026 Highlights:
- Revenue: $839.9 million vs analyst estimates of $776.5 million (7.4% year-on-year decline, 8.2% beat)
- Adjusted EPS: $2.16 vs analyst estimates of $1.94 (11.5% beat)
- Adjusted EBITDA: $180.6 million vs analyst estimates of $170.9 million (21.5% margin, 5.7% beat)
- The company lifted its revenue guidance for the full year to $3.4 billion at the midpoint from $3.32 billion, a 2.6% increase
- Management raised its full-year Adjusted EPS guidance to $9.62 at the midpoint, a 3.7% increase
- EBITDA guidance for the full year is $774 million at the midpoint, above analyst estimates of $765.3 million
- Operating Margin: 15.9%, in line with the same quarter last year
- Free Cash Flow Margin: 9.5%, down from 11.8% in the same quarter last year
- Organic Revenue rose 11.9% year on year (miss)
- Market Capitalization: $6.64 billion
Company Overview
Holding a Guinness World Record for creating the world’s fastest conveyor pizza oven, Middleby (NASDAQ: MIDD) is a food service and equipment manufacturer.
Revenue Growth
A company’s long-term performance is an indicator of its overall quality. Any business can have short-term success, but a top-tier one grows for years. Regrettably, Middleby’s sales grew at a mediocre 7.2% compounded annual growth rate over the last five years. This was below our standard for the industrials sector and is a rough starting point for our analysis.
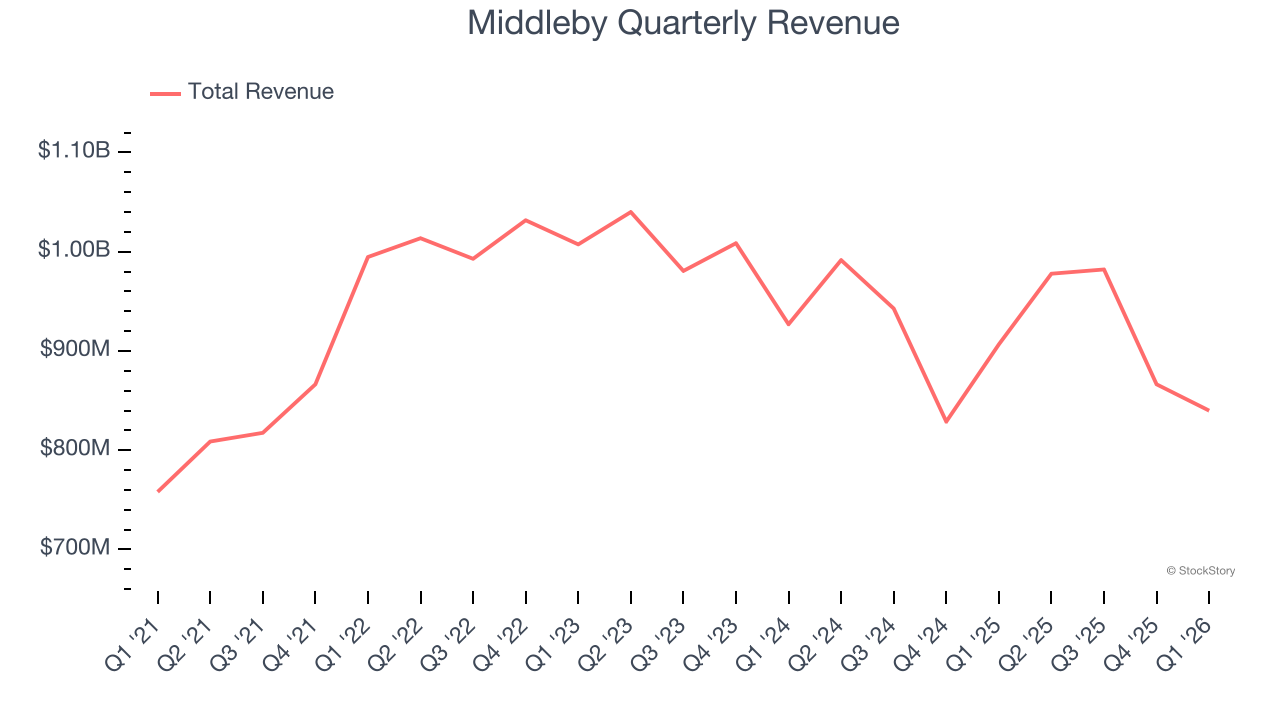
Long-term growth is the most important, but within industrials, a half-decade historical view may miss new industry trends or demand cycles. Middleby’s performance shows it grew in the past but relinquished its gains over the last two years, as its revenue fell by 3.7% annually. 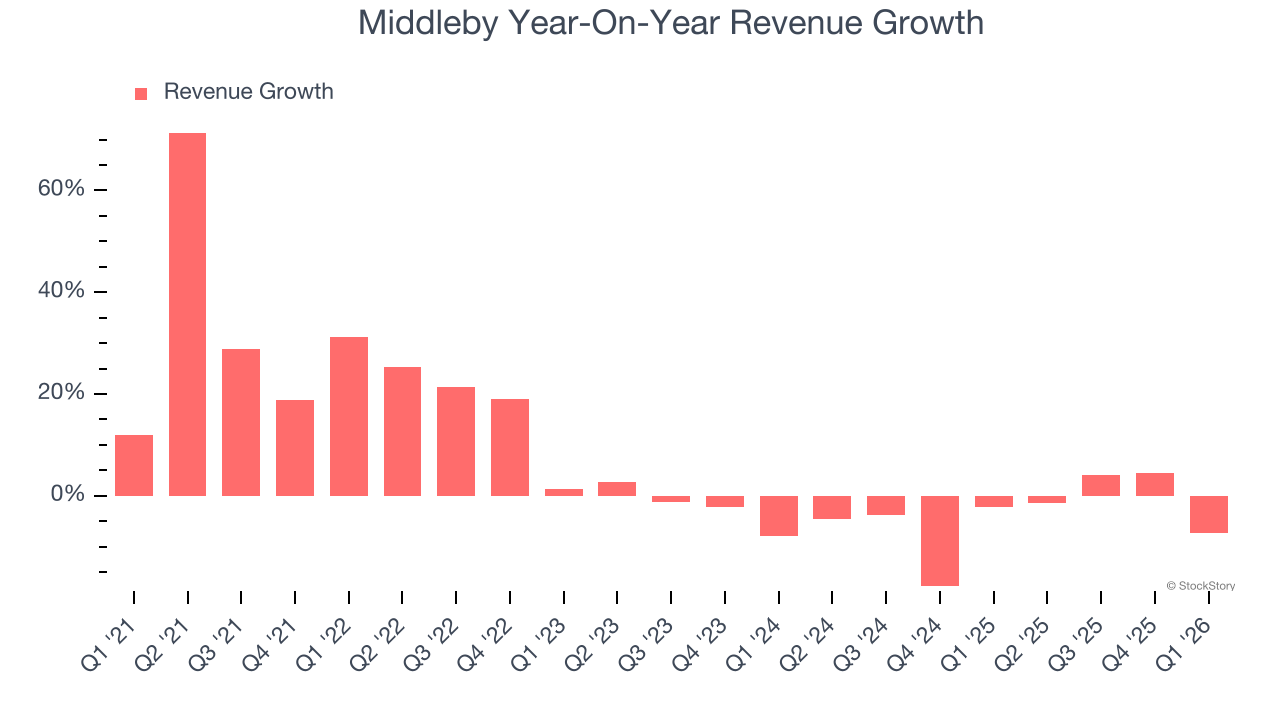
Middleby also reports organic revenue, which strips out one-time events like acquisitions and currency fluctuations that don’t accurately reflect its fundamentals. Over the last two years, Middleby’s organic revenue was flat. Because this number is better than its two-year revenue growth, we can see that some mixture of divestitures and foreign exchange rates dampened its headline results. 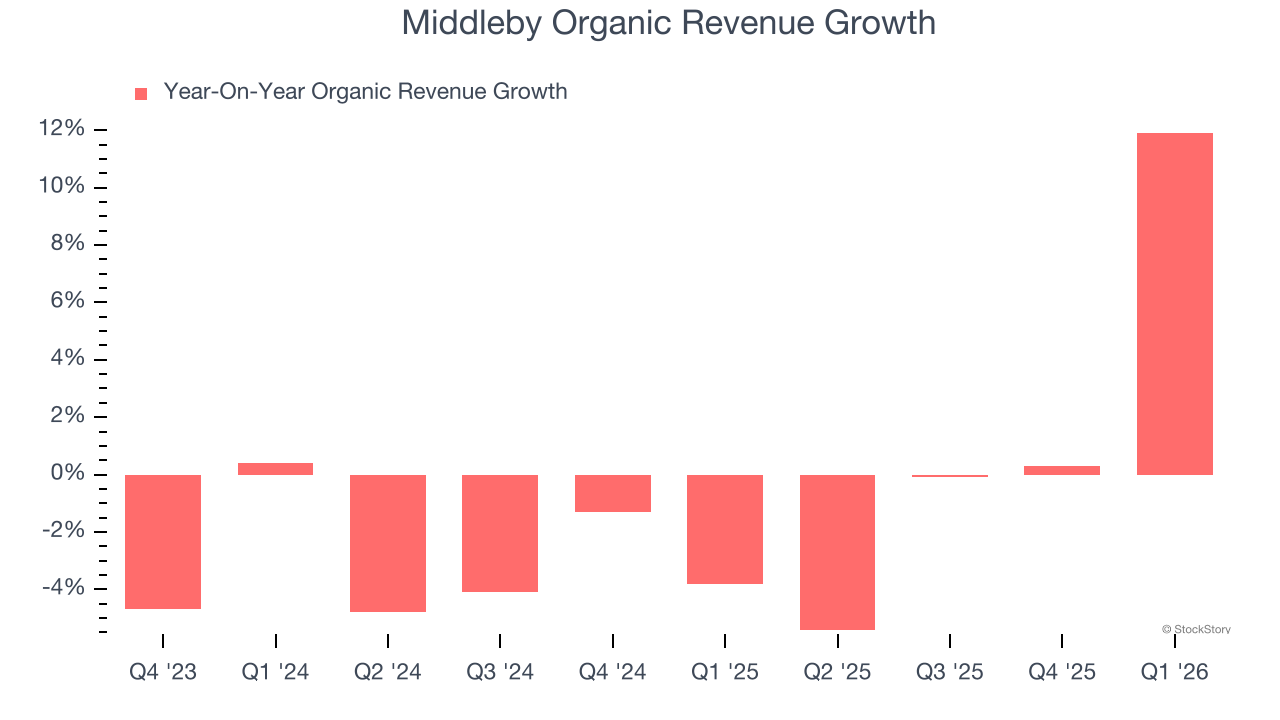
This quarter, Middleby’s revenue fell by 7.4% year on year to $839.9 million but beat Wall Street’s estimates by 8.2%. Company management is currently guiding for a 14.9% year-on-year decline in sales next quarter.
Looking further ahead, sell-side analysts expect revenue to decline by 8.6% over the next 12 months, a deceleration versus the last two years. This projection doesn't excite us and implies its products and services will face some demand challenges.
WHILE YOU’RE HERE: The Next Palantir? One satellite company captures images of every point on Earth. Every single day. The Pentagon wants it. Hedge funds are using it to beat earnings. You’ve probably never heard of it.
This is what the early days of Palantir looked like before it became a $437 billion giant. Same playbook. Different technology. If you missed Palantir, you need to see this. Claim The Stock Ticker for Free HERE.
Operating Margin
Middleby has been an efficient company over the last five years. It was one of the more profitable businesses in the industrials sector, boasting an average operating margin of 13.2%. This result isn’t surprising as its high gross margin gives it a favorable starting point.
Looking at the trend in its profitability, Middleby’s operating margin decreased by 21.3 percentage points over the last five years. This raises questions about the company’s expense base because its revenue growth should have given it leverage on its fixed costs, resulting in better economies of scale and profitability.
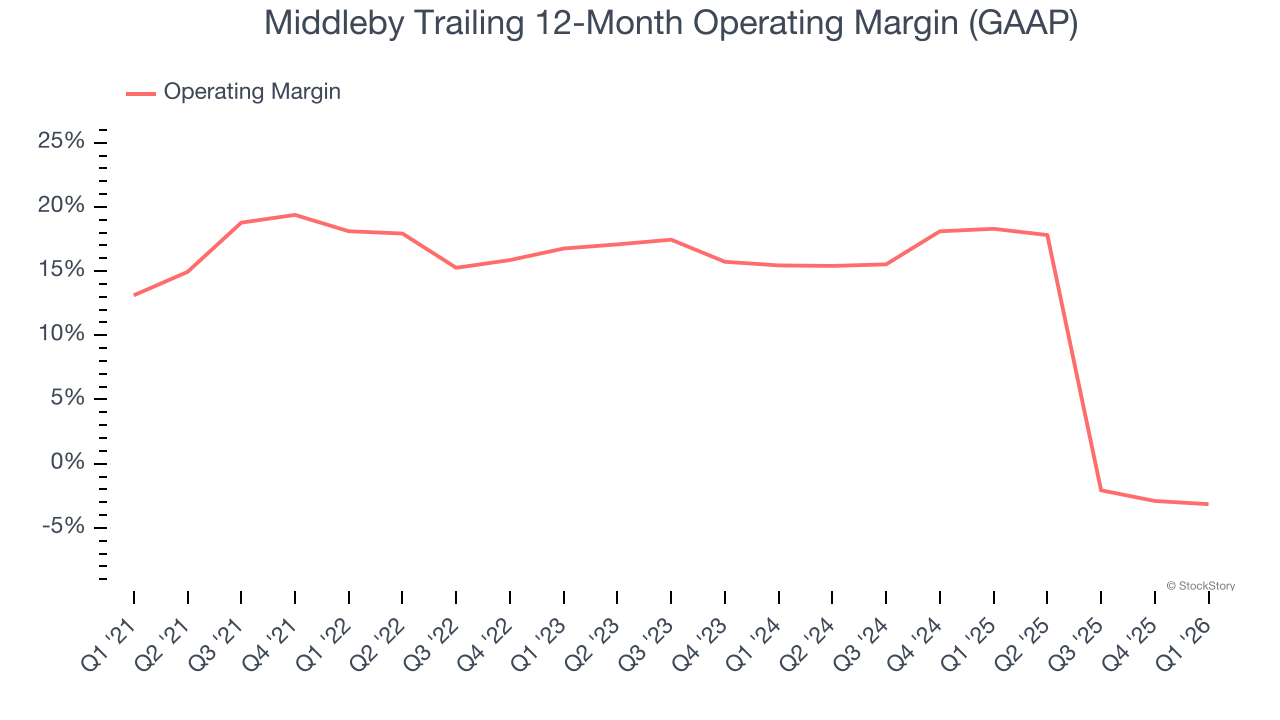
This quarter, Middleby generated an operating margin profit margin of 15.9%, in line with the same quarter last year. This indicates the company’s cost structure has recently been stable.
Earnings Per Share
We track the long-term change in earnings per share (EPS) for the same reason as long-term revenue growth. Compared to revenue, however, EPS highlights whether a company’s growth is profitable.
Middleby’s EPS grew at 11.9% compounded annual growth rate over the last five years, higher than its 7.2% annualized revenue growth. However, this alone doesn’t tell us much about its business quality because its operating margin didn’t improve.
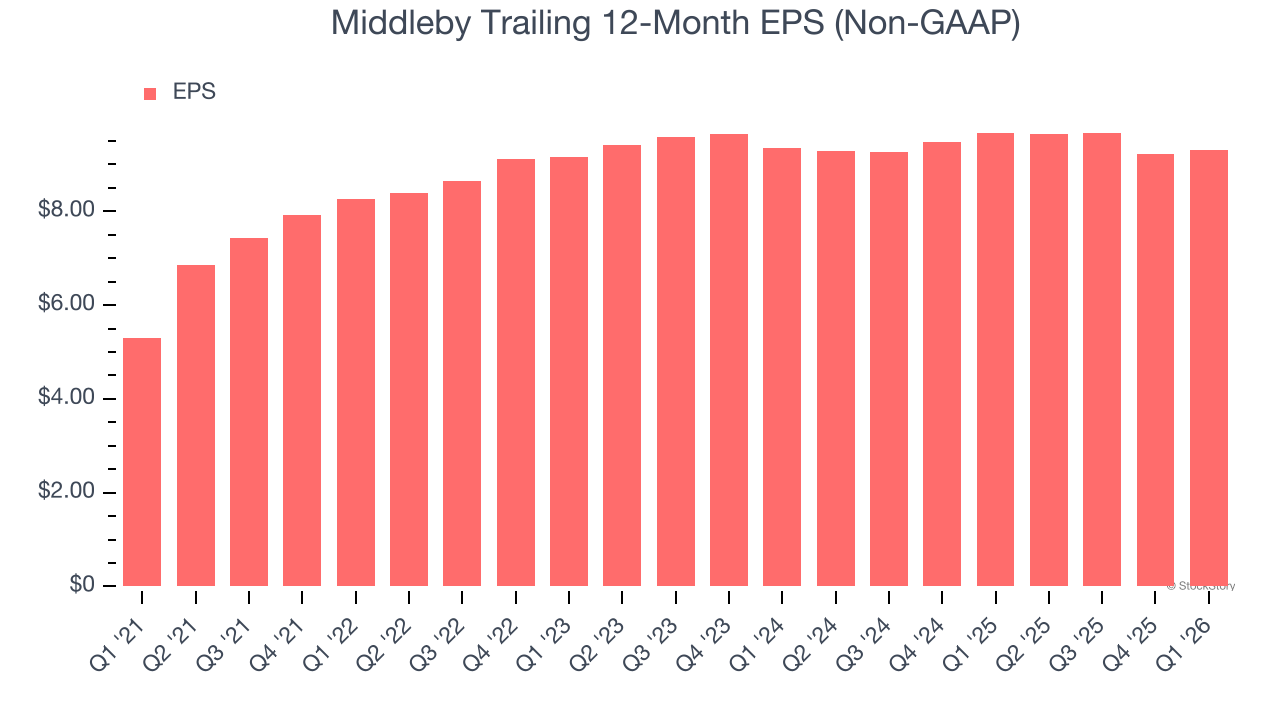
We can take a deeper look into Middleby’s earnings quality to better understand the drivers of its performance. A five-year view shows that Middleby has repurchased its stock, shrinking its share count by 15.6%. This tells us its EPS outperformed its revenue not because of increased operational efficiency but financial engineering, as buybacks boost per share earnings. 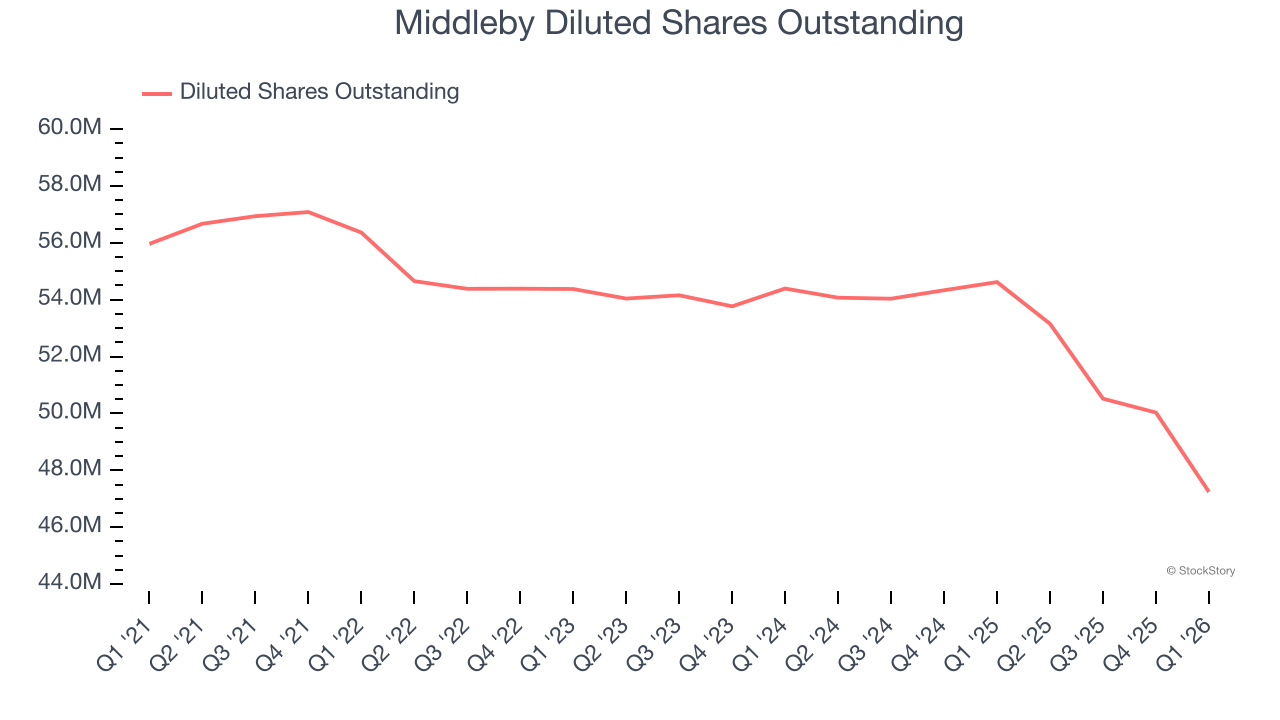
Like with revenue, we analyze EPS over a shorter period to see if we are missing a change in the business.
For Middleby, EPS didn’t budge over the last two years, a regression from its five-year trend. We hope it can revert to earnings growth in the coming years.
In Q1, Middleby reported adjusted EPS of $2.16, up from $2.08 in the same quarter last year. This print easily cleared analysts’ estimates, and shareholders should be content with the results. Over the next 12 months, Wall Street expects Middleby’s full-year EPS of $9.30 to grow 3.8%.
Key Takeaways from Middleby’s Q1 Results
We were impressed by how significantly Middleby blew past analysts’ revenue expectations this quarter. We were also glad its full-year revenue guidance exceeded Wall Street’s estimates. On the other hand, its adjusted operating income missed and its organic revenue fell short of Wall Street’s estimates. Overall, this print was mixed but still had some key positives. The stock traded up 4.6% to $149 immediately following the results.
Should you buy the stock or not? What happened in the latest quarter matters, but not as much as longer-term business quality and valuation, when deciding whether to invest in this stock. We cover that in our actionable full research report which you can read here (it’s free).


