American Eagle has been treading water for the past six months, holding steady at $16.65. The stock also fell short of the S&P 500’s 7.1% gain during that period.
Is there a buying opportunity in American Eagle, or does it present a risk to your portfolio? Check out our in-depth research report to see what our analysts have to say, it’s free.
Why Is American Eagle Not Exciting?
We're cautious about American Eagle. Here are three reasons you should be careful with AEO and a stock we'd rather own.
1. Lack of New Stores, a Headwind for Revenue
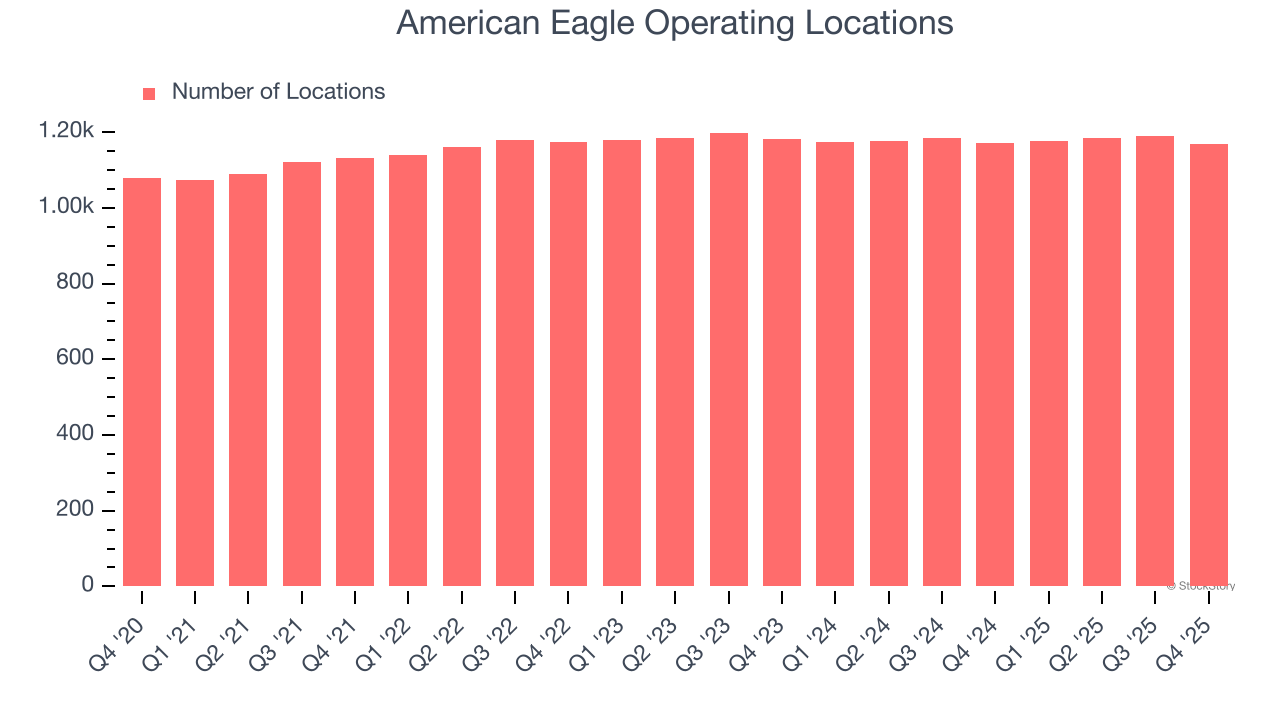
A retailer’s store count often determines how much revenue it can generate.
American Eagle operated 1,168 locations in the latest quarter, and over the last two years, has kept its store count flat while other consumer retail businesses have opted for growth.
When a retailer keeps its store footprint steady, it usually means demand is stable and it’s focusing on operational efficiency to increase profitability.
2. Shrinking Operating Margin
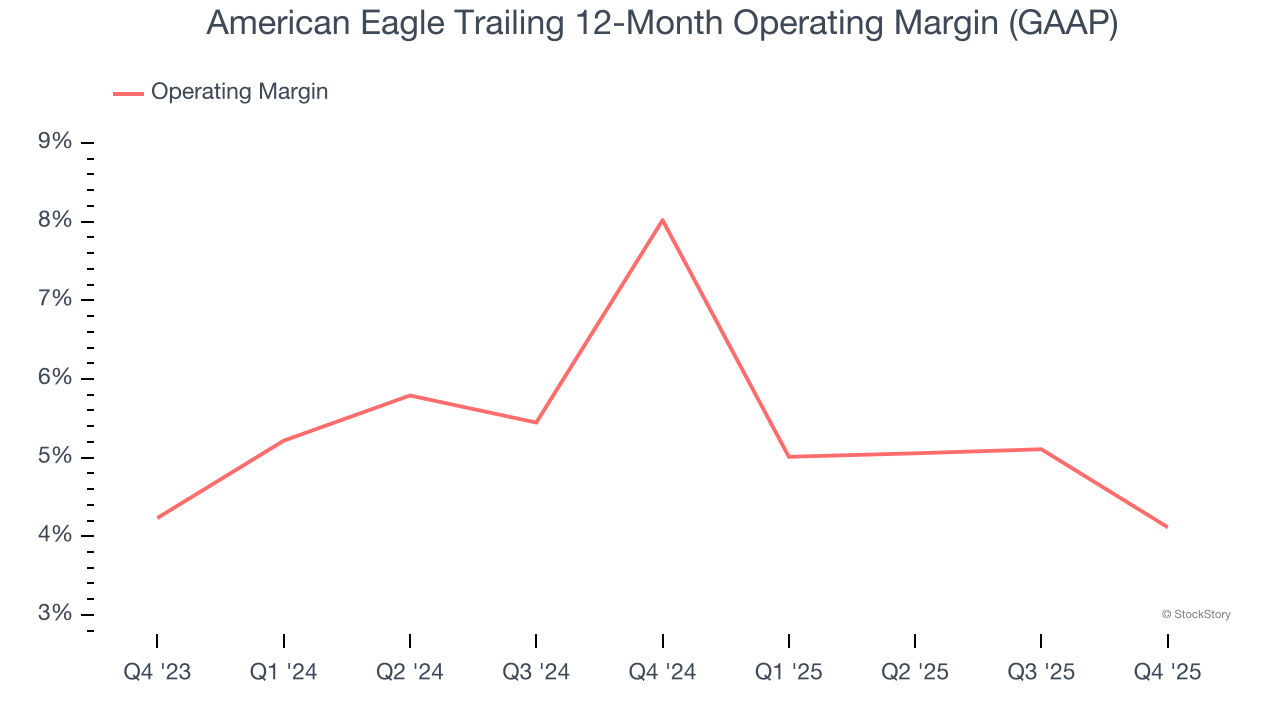
Operating margin is an important measure of profitability as it shows the portion of revenue left after accounting for all core expenses – everything from the cost of goods sold to advertising and wages. It’s also useful for comparing profitability across companies with different levels of debt and tax rates because it excludes interest and taxes.
Looking at the trend in its profitability, American Eagle’s operating margin decreased by 3.9 percentage points over the last year. This raises questions about the company’s expense base because its revenue growth should have given it leverage on its fixed costs, resulting in better economies of scale and profitability. American Eagle’s performance was poor no matter how you look at it - it shows that costs were rising and it couldn’t pass them onto its customers. Its operating margin for the trailing 12 months was 4.1%.
3. Previous Growth Initiatives Haven’t Impressed
Growth gives us insight into a company’s long-term potential, but how capital-efficient was that growth? A company’s ROIC explains this by showing how much operating profit it makes compared to the money it has raised (debt and equity).
American Eagle historically did a mediocre job investing in profitable growth initiatives. Its five-year average ROIC was 8.8%, somewhat low compared to the best consumer retail companies that consistently pump out 25%+.
Final Judgment
American Eagle isn’t a terrible business, but it isn’t one of our picks. With its shares lagging the market recently, the stock trades at 9.3× forward P/E (or $16.65 per share). While this valuation is optically cheap, the potential downside is big given its shaky fundamentals. We're fairly confident there are better stocks to buy right now. Let us point you toward a top digital advertising platform riding the creator economy.
Stocks We Like More Than American Eagle
ALSO WORTH WATCHING: Top 5 Momentum Stocks. The best time to own a great stock is when the market is finally noticing it. These aren't just high-quality businesses. Something is happening with them right now. Elite fundamentals meeting near-term momentum - both boxes checked at the same time.
Find out which stocks our AI platform is flagging this week. See this week's Strong Momentum stocks - FREE. Get Our Strong Momentum Stocks for Free HERE.
Stocks that have made our list include now familiar names such as Nvidia (+1,326% between June 2020 and June 2025) as well as under-the-radar businesses like the once-small-cap company Comfort Systems (+782% five-year return). Find your next big winner with StockStory today.